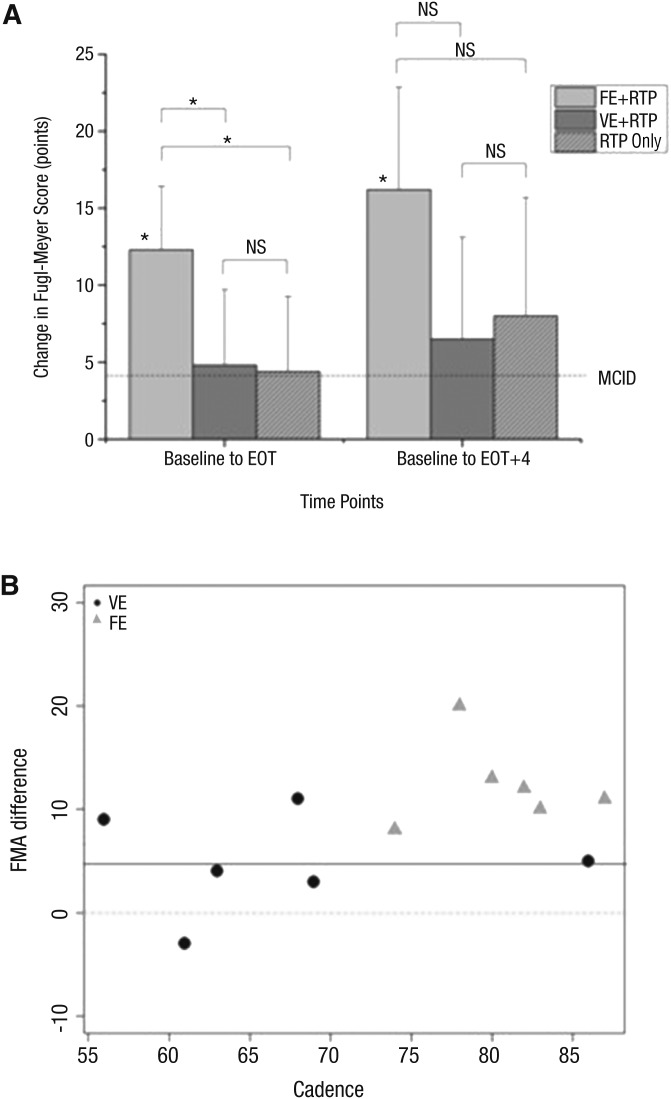
Figure 2.
(A) Changes in upper-extremity FMA motor scores from baseline to EOT and from baseline to EOT + 4. (B) The relationship between average cadence (pedaling rate in revolutions per minute) during the intervention and change in FMA motor scores.
The dashed line in 2A represents MCID on the FMA. All participants in the FE group (gray triangles, 2B) exhibited improvement greater than the MCID for the FMA, whereas the VE group (black circles) had 3 participants who did not achieve the MCID.
Note. EOT = end of treatment; EOT + 4 = 4 wk after EOT; FE = forced exercise; FMA = Fugl-Meyer Assessment; MCID = minimal clinically important difference; NS = not significant; RTP = repetitive task practice only; VE = voluntary exercise.
*p < .05.

