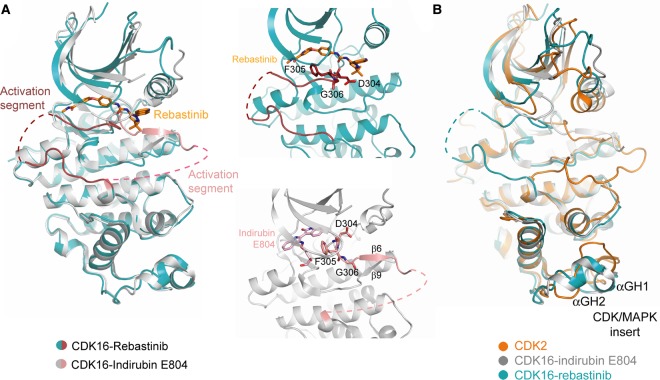
Figure 7. CDK16 structures show different conformations.
(A) Superposition of the different CDK16 structures (left panel) shows the alternative conformations adopted by the activation segment when in complex with indirubin E804 (type I inhibitor) or rebastinib (type II inhibitor). Right panel shows the respective positions of residues in the ‘DFG motif’. (B) Superposition of CDK2 (PDB ID: 5IF1 [59]) and CDK16 structures reveals structural differences in the CDK/MAPK insert. Colours are indicated by the keys provided.

