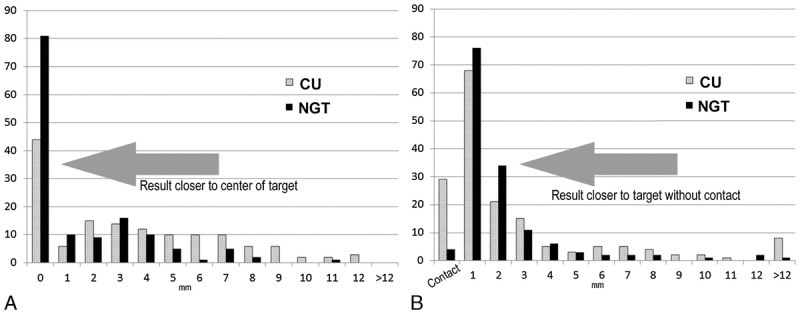
FIGURE 4.

Histograms of accuracy based on the distance (in millimeters) relative to the intended target by task type for (A) target-contact tasks and (B) target-proximity tasks, showing frequency as number n of tasks (y axis) where the needle tip was placed at a distance relative to the intended target in 1-mm increments (x axis). More NGT tasks (black bars) achieved distances closer to targets compared with CU tasks (gray bars). Furthermore, the number of unintentional contacts (B, leftmost bars) and wide misses (>12 mm, rightmost bars) were lower among NGT tasks for both target-proximity and target-contact tasks.
