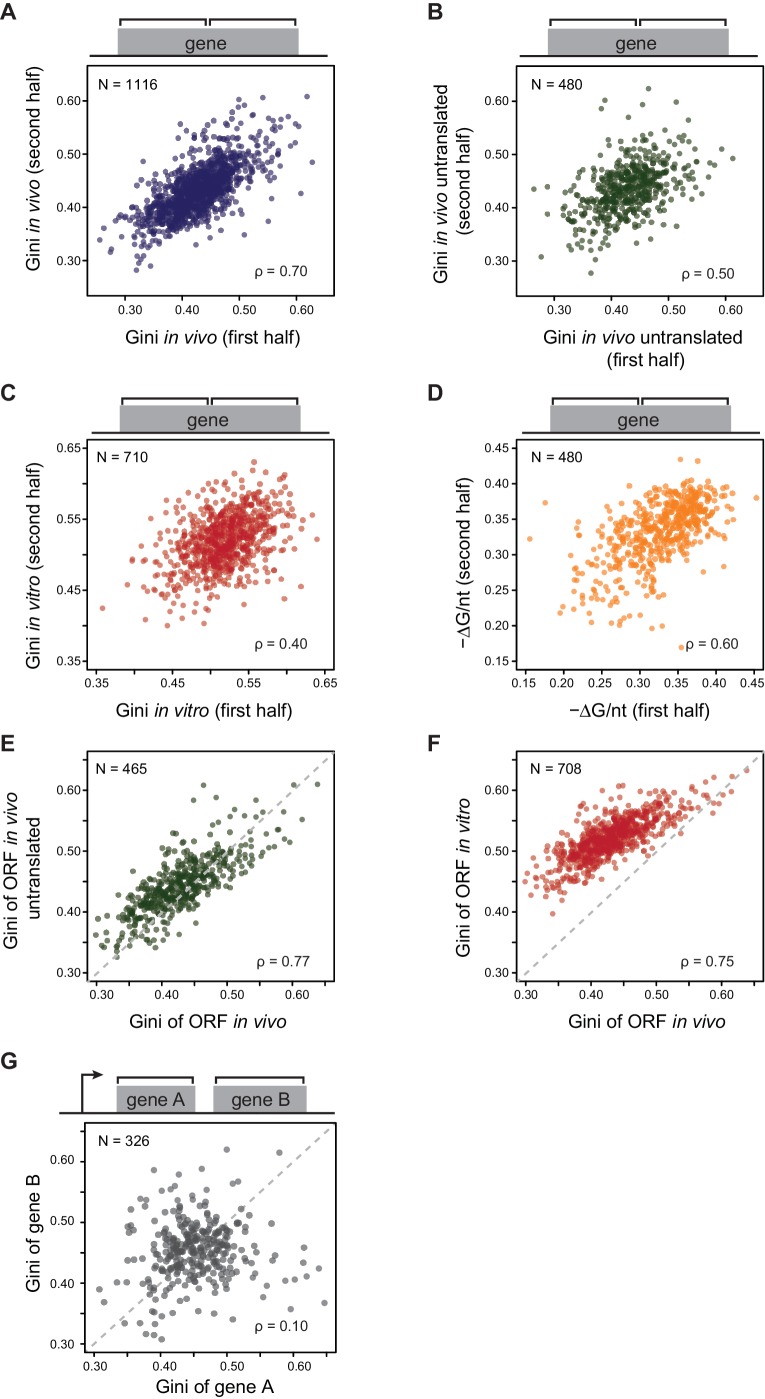
Figure 2. E. coli mRNAs have intrinsic ORF-wide secondary structures.
(A–C) Plots comparing the Gini indices of the first half of the ORF against those of the second half of the ORF for: A. in vivo modified mRNA from cells growing at 37°C; B. in vivo modified mRNA from cells treated with kasugamycin (ksg) at 37°C (no translating ribosomes); C. in vitro mRNA modified at 37°C. In this and all subsequent figures, analysis is performed only on those ORFs with ≥15 DMS-seq reads per nucleotide, with N (the number of ORFs analyzed in each condition), and ρ (the Spearman's rank correlation coefficient) indicated. The ksg-treated sample has fewer ORFs passing the ≥15 DMS-seq reads/nt filter, likely due to mRNA degradation when translation is eliminated. Data calculated using different sets of ORFs are summarized in Supplementary file 1–3. (D) Plot comparing the computationally predicted mRNA structure (- minimum free energy / nucleotide or -ΔG/nt) of the first half of the ORF against that of the second half of the ORF for the 480 ORFs in the ksg-treated DMS-seq dataset. (E) Correlation between Gini indices of the entire ORF calculated from in vivo mRNA vs in vivo untranslated mRNA (ksg-treated cells) for the 465 ORFs in both datasets. The dashed grey line represents the y = x diagonal line. (F) Correlation between Gini indices of the entire ORF calculated from in vivo mRNA vs in vitro refolded mRNA for the 708 ORFs shared in both datasets. (G) Plot comparing Gini indices for adjacent ORFs in operons (N = 326; see Materials and methods for details). The dashed grey line represents the y = x diagonal line.


