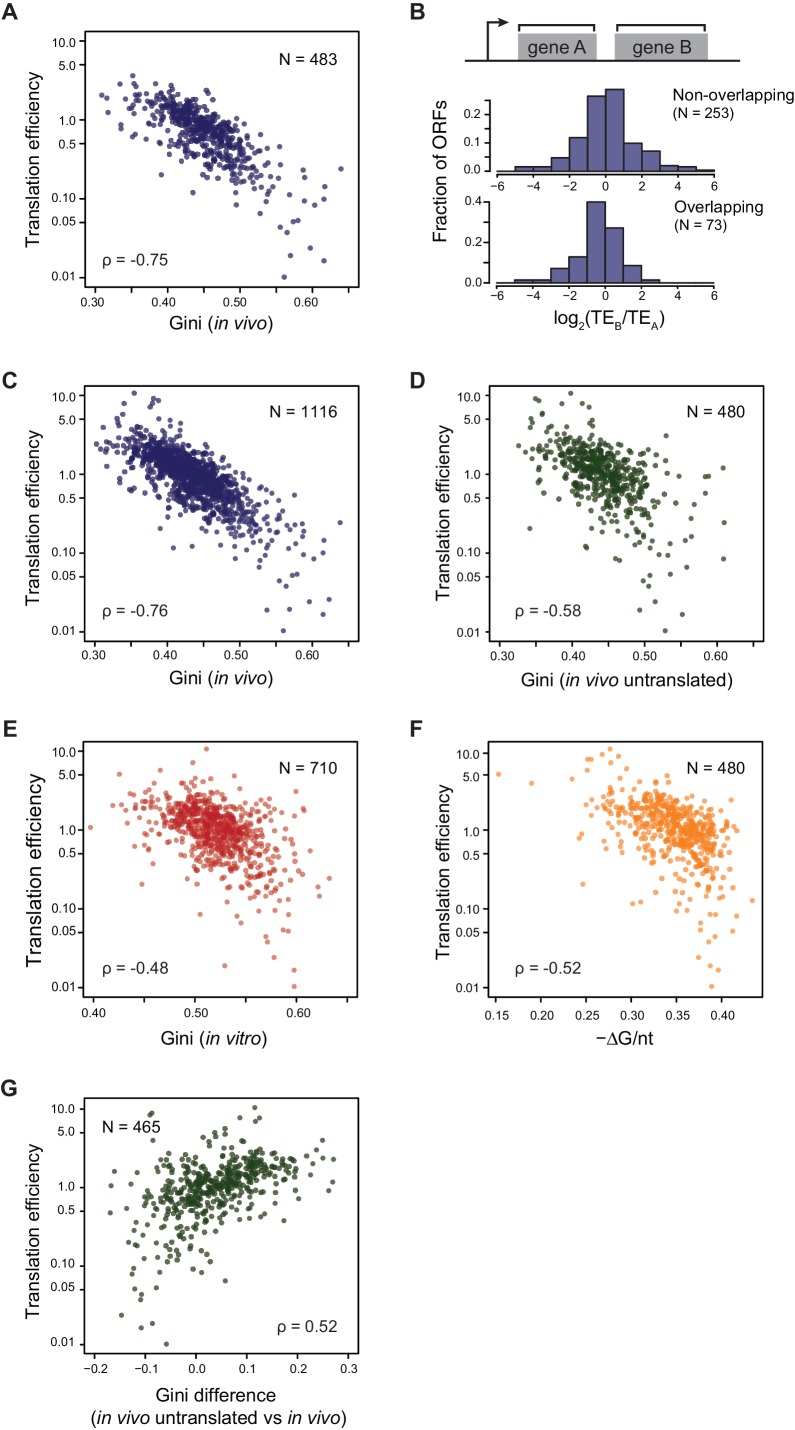
Figure 3. Translational efficiency (TE) is highly correlated with ORF mRNA structure.
(A) Plots comparing the Gini indices of ORFs in polycistronic operons calculated from in vivo DMS-seq to their TEs (N = 483). (B) Histograms of TE ratios between adjacent non-overlapping (N = 253) or overlapping (N = 73) ORFs in operons (see Materials and methods for details). Overlapping ORFs are ORF pairs for which the annotated stop codon of the upstream ORF overlaps or is 3’ of the start codon of the downstream ORF. (C–E) Plots comparing the Gini indices of endogenous ORF mRNAs calculated from DMS-seq data of: C. in vivo RNA; D. in vivo RNA with no translating ribosomes (Ksg treated cells); E. in vitro modified refolded mRNA, to their TEs. For this and all subsequent panels, data calculated using different sets of ORFs are summarized in Supplementary file 1–3. (F) Plot comparing computationally predicted mRNA structure (- minimum free energy / nucleotide; -ΔG/nt) of the entire ORF body to TE. (G) Plots of the difference in the Gini index between untranslated (ksg-treated) and translated in vivo mRNA against their TE for the 465 ORFs in both datasets. X-axis: Gini index (in vivo untranslated) – Gini index (in vivo), normalized by the average of the two.


