. 2017 Feb 20;6:e20214. doi: 10.7554/eLife.20214

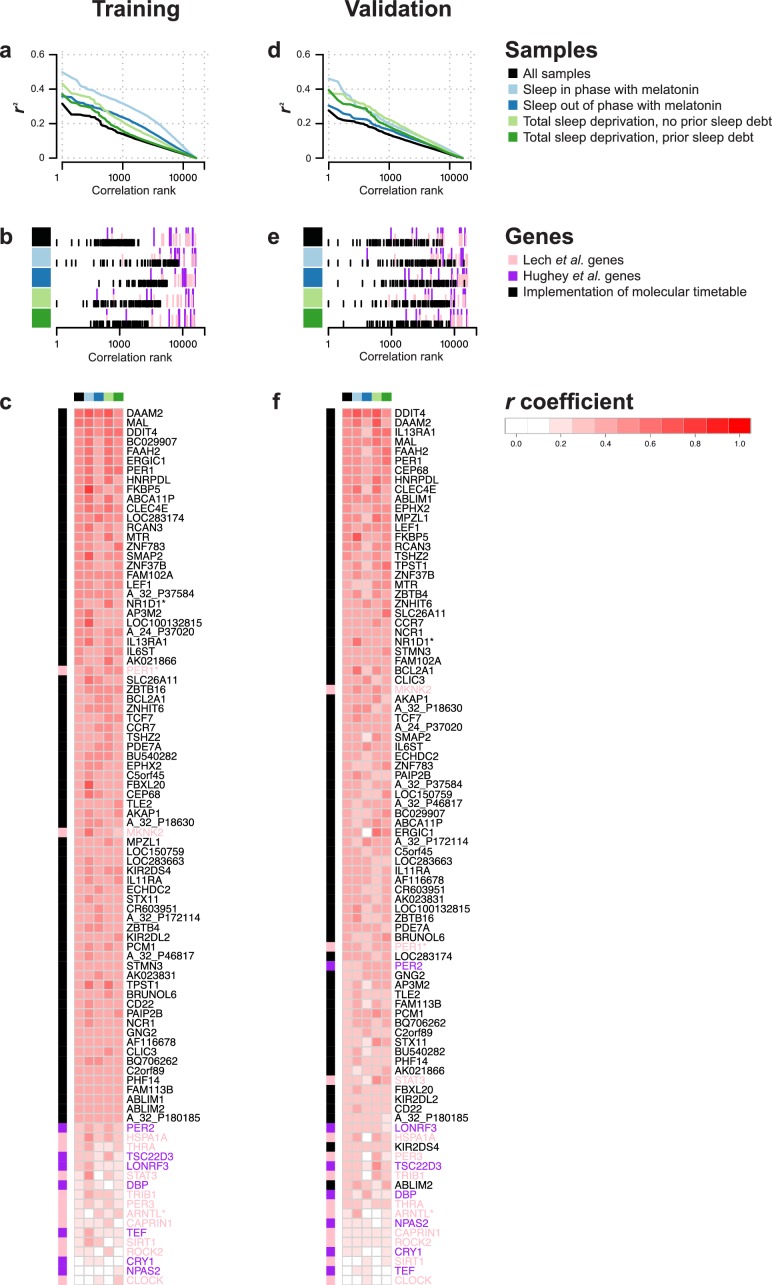
Figure 2. Rhythmicity in the conditions and identification of molecular timetable genes.

(ad) Square of correlation value (r2) vs. rank of correlation as a measure of overall 24 hr rhythmicity in the transcriptome, separately and across conditions. For each transcript, the correlation with a cosine wave was computed, squared and the entire transcriptome was then rank-ordered separately for each conditions and across conditions. (b, e) Rank of the correlation of phase marker genes from different phase marker lists across conditions (indicated by color panel to the left) for participants in the training (b) and validation set (e). First, correlations of all ~26K features were ranked separately for conditions and training and validation set and then the rank of identified phase marker genes was identified and plotted. (c,f) Heatmap of r values of correlation between a 24 hr cosine wave and mRNA abundance profiles of a feature(s) targeting a gene identified as a phase marker by our molecular timetable, and the circadian phase marker genes published in Lech et al. (2016) and Hughey et al. (2016). Correlations were computed separately for each of the four conditions (indicated by the color panel at the top of the heatmap) and all conditions combined for the training (c) or validation set (f). Rows in the heatmap are ordered based on the correlation column for the ‘all conditions’ dataset, that is, the column indicated with black. Data source files: Figure 2—source data 1.

DOI: http://dx.doi.org/10.7554/eLife.20214.003

Figure 2—source data 1. Source data file for generating panels in Figure 2.
DOI: 10.7554/eLife.20214.004

Figure 2.

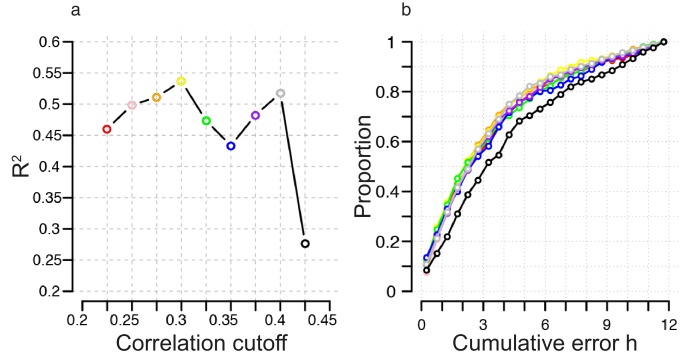
Figure 2—figure supplement 1. Identification of correlation cutoff threshold for the construction of a molecular timetable.

Figure 2—figure supplement 1.

(a) Effect of cutoff threshold on performance of molecular timetable models constructed using genes meeting a particular threshold. Performance assessed by R2 values following leave-one-participant-out cross-validation of the training set. (b) Performance quantified as the proportion of samples vs. cumulative error for each constructed model following leave-one-participant-out cross-validation of the training set (colors correspond to the threshold colors in panel a).
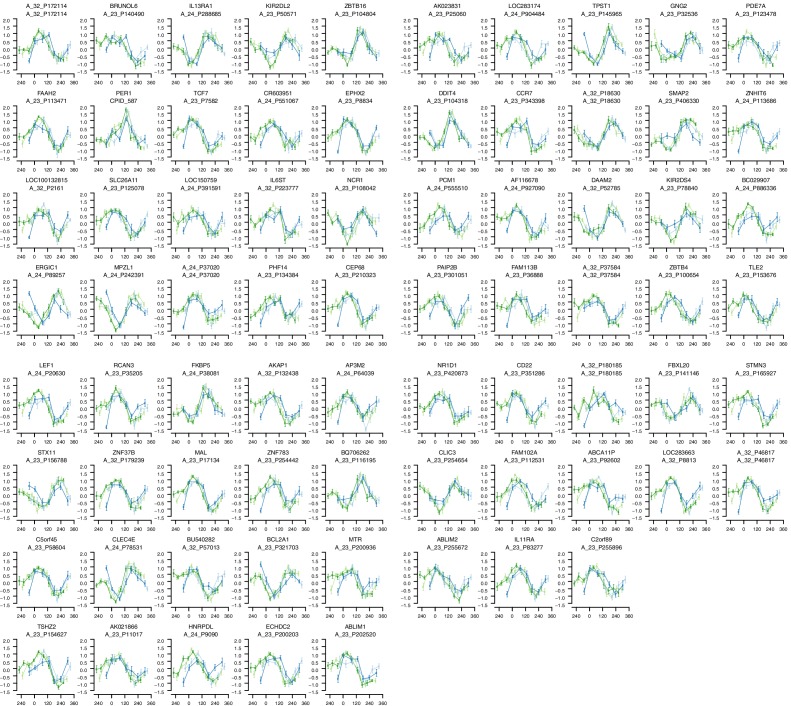
Figure 2—figure supplement 2. mRNA abundance profiles for genes belonging to the phase marker gene list generated by our implementation of the molecular timetable model.

Figure 2—figure supplement 2.

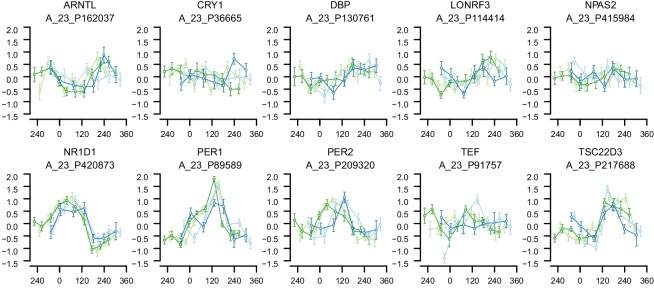
Data are shown separately for the four conditions. Color of lines correspond to that in Figure 1 of the main text; Light blue: ‘sleep in phase with melatonin’, Dark blue: ‘sleep out of phase with melatonin’, Light green: ‘total sleep deprivation, no prior sleep debt’, and Dark green: ‘total sleep deprivation, prior sleep debt’. Title of each sub-plot denotes the probe and gene name for which the temporal profile is shown. x-axis of each sub-plot corresponds to circadian phase in degrees, where zero degrees corresponds to Dim Light Melatonin Onset (DLMO). y-axis indicates the Z-scored mRNA abundance. Average time course calculated from aligned (by DLMO) participant mRNA abundance profiles, with error bars indicating Standard Error. Data shown for participants belonging to the training set only.
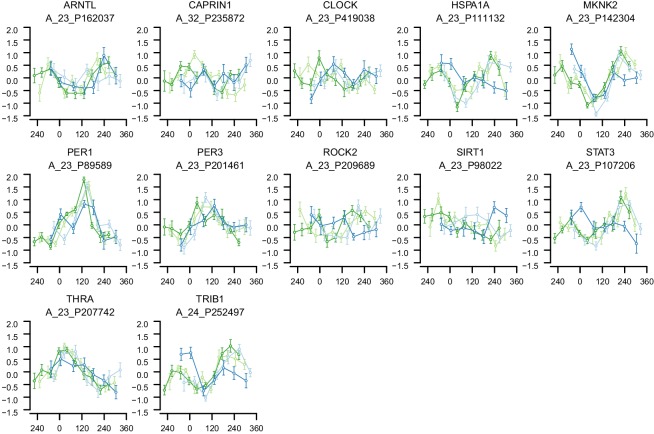
Figure 2—figure supplement 3. mRNA abundance profiles for genes belonging to the phase marker gene list published in (Lech et al., 2016).

Figure 2—figure supplement 3.

Data are show separately for the four conditions. Color of lines correspond to that in Figure 1 of the main text; Light blue: ‘sleep in phase with melatonin’, Dark blue: ‘sleep out of phase with melatonin’, Light green: ‘total sleep deprivation, no prior sleep debt’, and Dark green: ‘total sleep deprivation, prior sleep debt’. Title of each sub-plot denotes the probe and gene name for which the temporal profile is shown. x-axis of each sub-plot corresponds to circadian phase in degrees, where 0 degrees corresponds to Dim Light Melatonin Onset (DLMO). y-axis the Z-scored mRNA abundance. Average time course calculated from aligned (by DLMO) participant mRNA abundance profiles, with error bars indicating Standard Error. Data shown for participants belonging to the training set only.
Figure 2—figure supplement 4. mRNA abundance profiles for genes belonging to the phase marker gene list published in (Hughey et al., 2016).

Figure 2—figure supplement 4.

Data are shown separately for the four conditions. Color of lines correspond to that in Figure 1 of the main text; Light blue: ‘sleep in phase with melatonin’, Dark blue: ‘sleep out of phase with melatonin’, Light green: ‘total sleep deprivation, no prior sleep debt’, and Dark green: ‘total sleep deprivation, prior sleep debt’. Title of each sub-plot denotes the probe and gene name for which the temporal profile is shown. x-axis of each sub-plot corresponds to circadian phase in degrees, where zero degrees corresponds to Dim Light Melatonin Onset (DLMO). y-axis the Z-scored mRNA abundance. Average time course calculated from aligned (by DLMO) participant mRNA abundance profiles, with error bars indicating Standard Error. Data shown for participants belonging to the training set only.