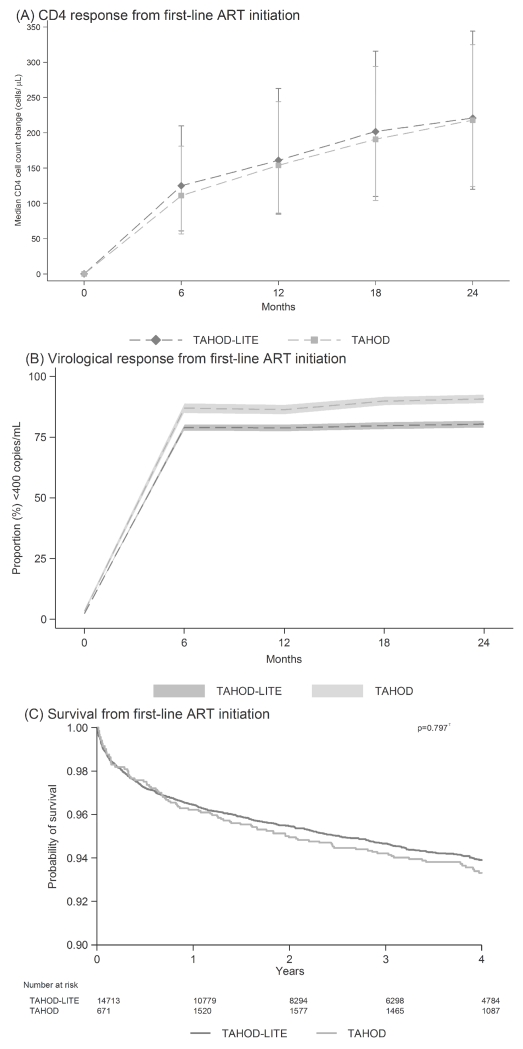
Figure 1. The response to first-line ART, by cohort.
(A) Median CD4 cell count change (cells/μL), with interquartile range, from ART initiation across all countries, by cohort. (B) Proportion of patients with HIV viral load <400 copies/mL since ART initiation across all countries, by cohort, where the shaded region represents the 95% binomial proportion confidence interval. (C) Probability of survival, as from Kaplan-Meier estimates, from ART initiation across all countries, by cohort (τ = log rank test).

