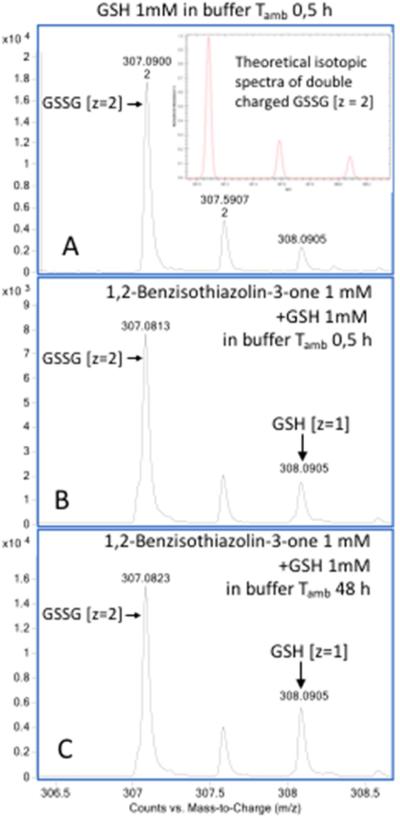
Figure 6.
Evaluation by mass spectrometry of reduced glutathione (GSH) levels following incubation of (1) in aqueous buffer containing an equimolar concentration of GSH. The amount of GSH has been estimated by the intensity of its monoisotopic mass (m/z 308.091, z =1) corrected for the intensity of the isobaric component present in the isotopic pattern of concurrent double charged GSSG (m/z 307.09, z =2), equivalent to 14.7 % of the monoisotopic mass intensity (insert in panel A). GSH (1 mM) was incubated 0.5 hours in aqueous buffer (75:25 v/v ammonium bicarbonate 40 mM, pH 8.0, CH3CN) with the resulting analysis showing > 99% oxidation to GSSG, as deduced from isotopic ratio of the double charged GSSG (panel A). Meanwhile the presence of (1) 1,2-benzisothiazolin-3-one gave rise to significant concentrations of GSH that increased over 48 hours (panel B, C and table 2). Samples were analyzed by direct infusion as described in the Material and methods. Resolution 10000, accuracy 5 ppm.

