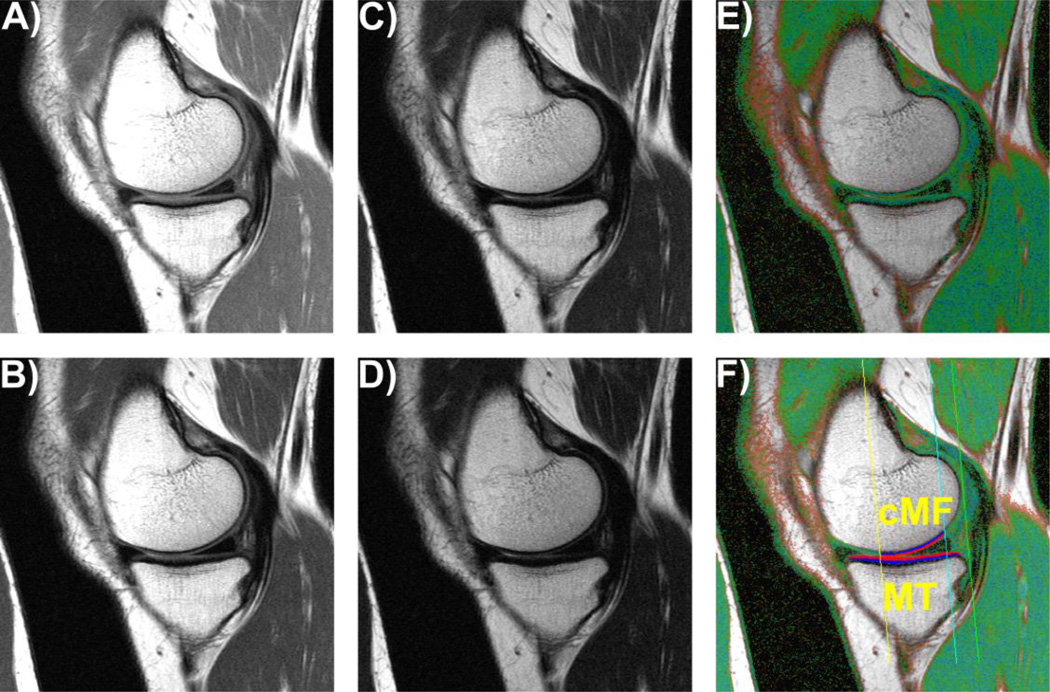
Fig. 1.
Sagittal multi-echo spin-echo (MESE) images showing the cartilages in the medial compartment; A) – D) MESE images acquired at echo times of 10, 30, 50, and 70 ms; E) Color-coded T2map; F) T2 map as in E), showing the femoral region of interest (ROI) and the segmented cartilage of the medial tibia (MT) and the central medial femur (cMF) divided into the superficial (red) and deep (blue) cartilage layers.

