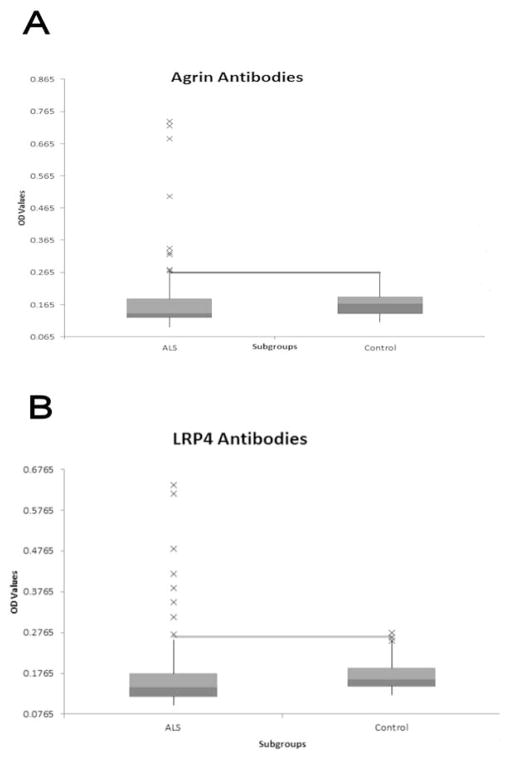
Figure 1. Distribution of Agrin and LRP4 antibodies<.
br>Bar and whisker graphs show the median, minimum, and maximum values and upper and lower quartiles of the study population. Outliers are indicated by x on the graph. The line indicates the upper limit of normal. A: Distribution of Agrin antibodies in the ALS population compared to normal controls. B: Distribution of LRP4 antibodies in the ALS population compared to normal controls. OD: Optical Density.

