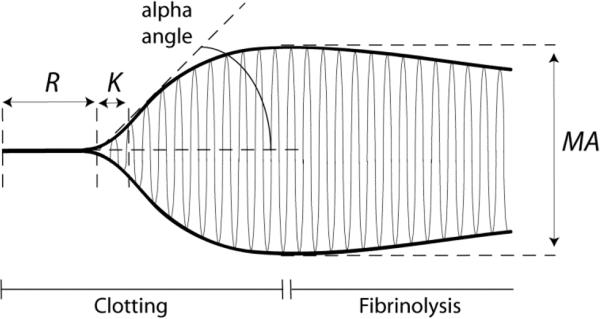
Figure 1.
Thromboelastography and thromboelastometry are commonly used in clinical medicine to characterize clotting. A typical thromboelastogram comprises a symmetrical curve that circumscribes the rotational amplitude of the anchor immersed in the clotting blood or plasma. The anchor starts oscillating when fibrin forms and connects the anchor to the walls of the oscillating cuvette. The main parameters of the curve are: R (minutes) – reaction time or time from initiation of clotting to the first signs of clot formation; K (minutes) – time until clot reaches about 20 mm; MA – maximal amplitude or the maximum strength of the clot; alpha angle (degrees) – the angle that reflects with K the rate of fibrin formation or clotting; MA (mm) – maximal amplitude or stiffness of the clot. Fibrinolysis can be measured as the eventual decrease of stiffness of the clot as it is digested.

