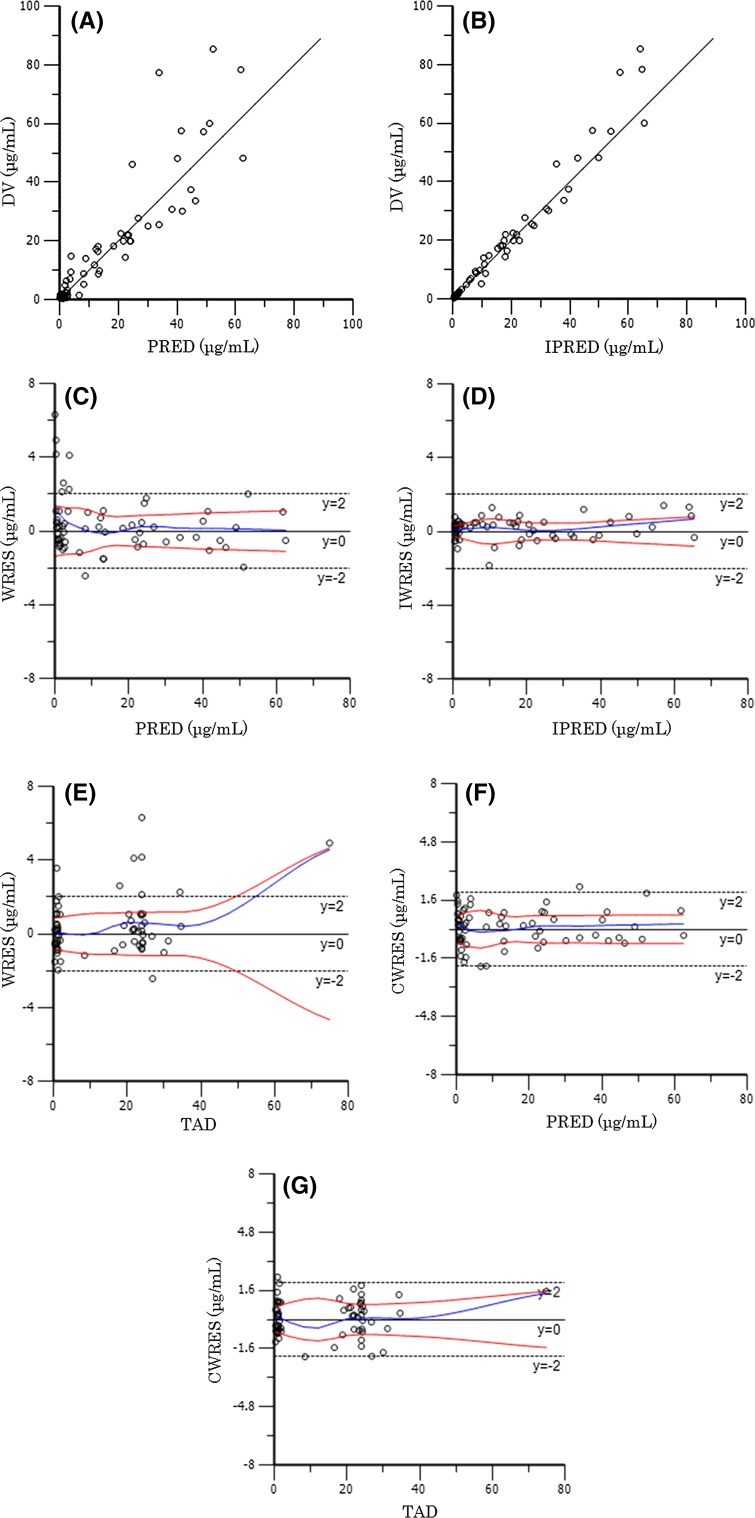
Fig. 1.
Scatter plots of population predicted concentrations (PRED) vs. observed concentrations (DV) (a) and individual predicted concentrations (IPRED) vs. DV (b), weighted residuals (WRES) vs. the PRED (c), the individual weighted residuals (IWRES) vs. the IPRED (d), the WRES vs. time after dose (TAD) (e), conditional weighted residuals (CWRES) vs. the PRED (f), and the CWRES vs. the TAD (g)

