
Figure 5.
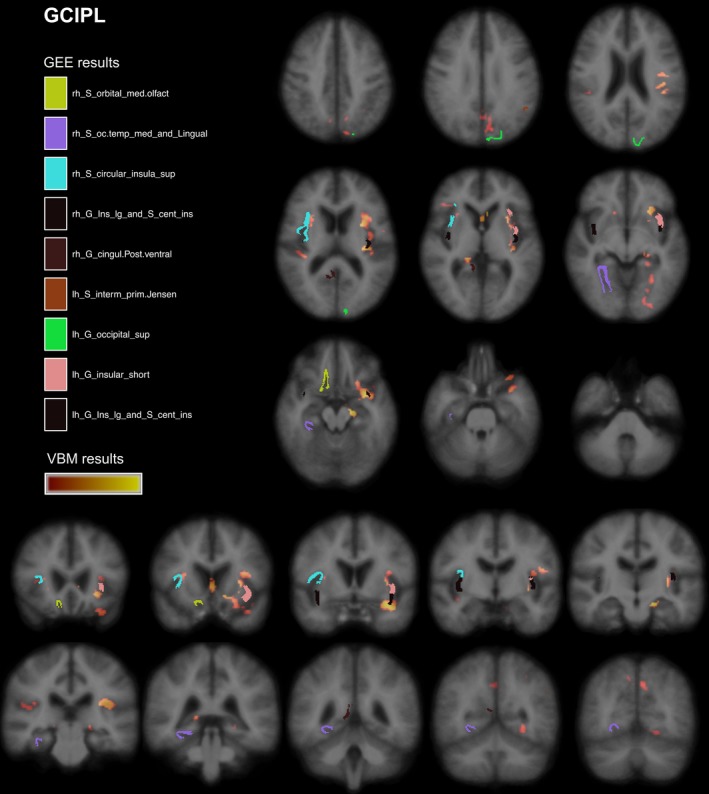
FreeSurfer and VBM regions associated with GCIPL. Results from VBM analysis in pale red (p = .04) to yellow (p < .001) and significantly associated cortical regions (FreeSurfer parcellation) from GEE models. Displayed on MNI152 standard space