
Figure 6.
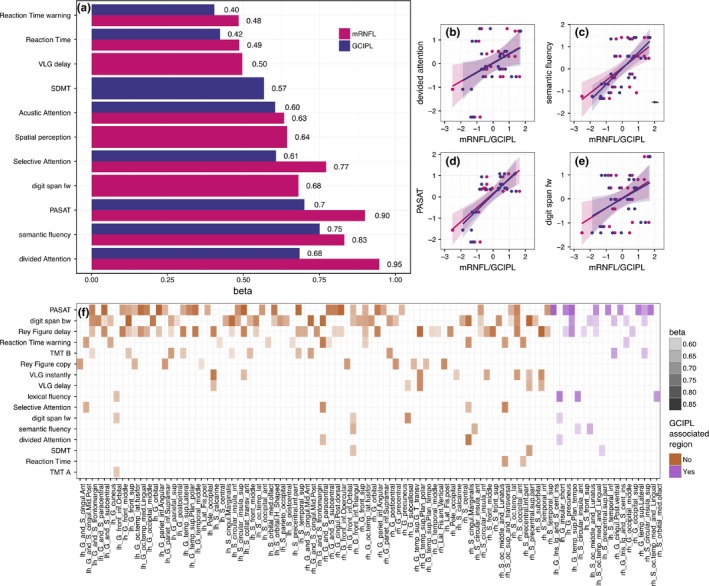
Association between retinal layers, cognitive performance, and cortical regions. (a) Association between cognitive tests (details see method section) and mRNFL/GCIPL thickness. Barplot presents significant standardized regression coefficients β from GEE models of cognitive tests and retinal layer thickness (mRNFL = purple and GCIPL = blue). (b–e) scatterplots with regression lines and its 95%CI (shaded area) for retinal layers and top four associated neuropsychological tests. (f) Cortical regions significantly correlated with neuropsychological tests in GEE models. Heat‐map shows only significant correlations (p < .05), shading represents standardized regression coefficient β. Cortical regions that are associated with cognitive performance and GCIPL, are shown in purple on the right side