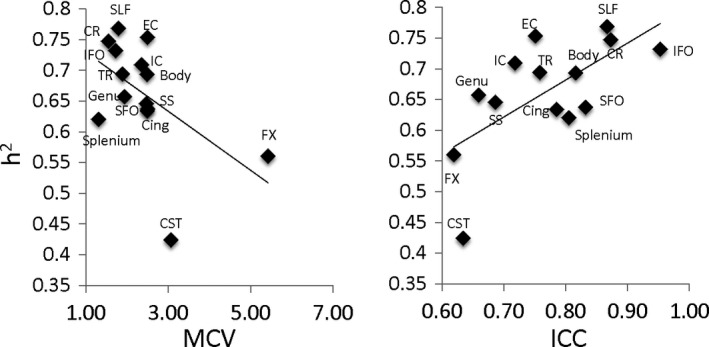
Figure 4.

Heritability (h 2) measurements for regional FA values calculated by ENIMGA‐DTI workgroup were plotted versus MCV and ICC reproducibility parameters in the adolescent cohort (FH). Linear regression analysis showed a significant and negative correlation between h 2 and CV (r = −.53, p = .04) and a significant positive correlation with ICC (r = −.65, p = .01). The plot for h 2 and MAD values was identical to that of MCV and therefore was omitted
