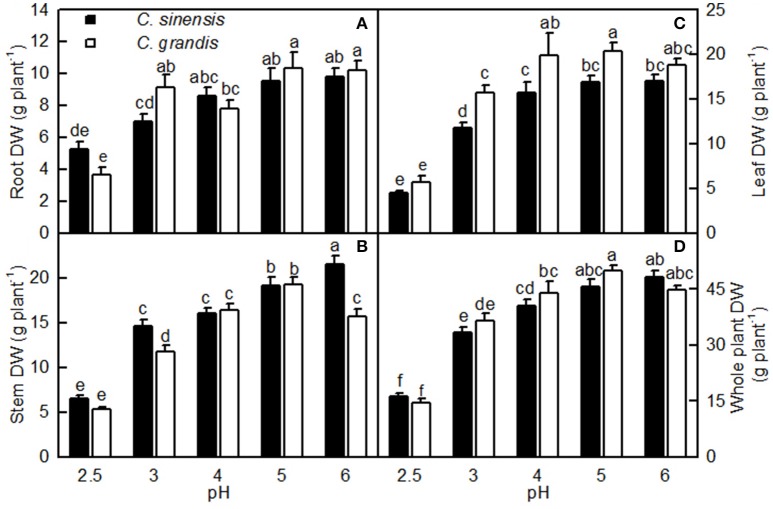
Figure 1.
Effects of pH on root (A), stem (B), leaf (C), and whole plant (D) DW of Citrus sinensis and Citrus grandis seedlings. Bars represent means ± SE (n = 10). Differences among the 10 treatments were analyzed by two (species) × five (pH) factorial ANOVA. Different letters above the bars indicate a significant difference at P < 0.05.

