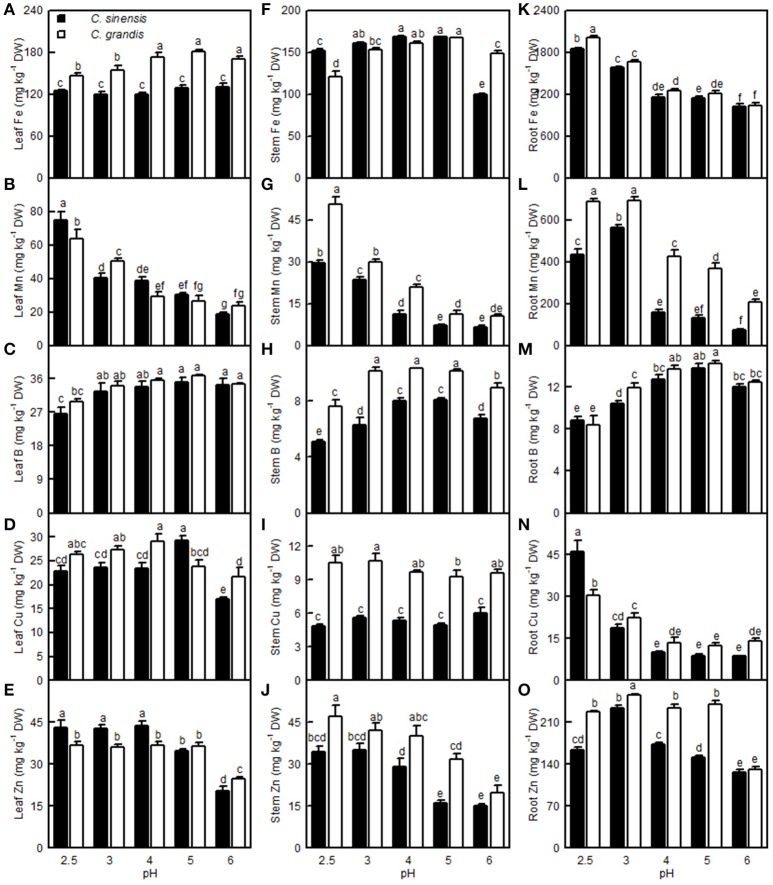
Figure 12.
Effects of pH on the Fe (A,F,K), Mn (B,G,L), B (C,H,M), Cu (D,I,N), and Zn (E,J,O) concentrations in the C. sinensis and C. grandis leaves, stems, and roots. Bars represent means ± SE (n = 4). Differences among the 10 treatments were analyzed by two (species) × five (pH) factorial ANOVA. Different letters above the bars indicate a significant difference at P < 0.05.

