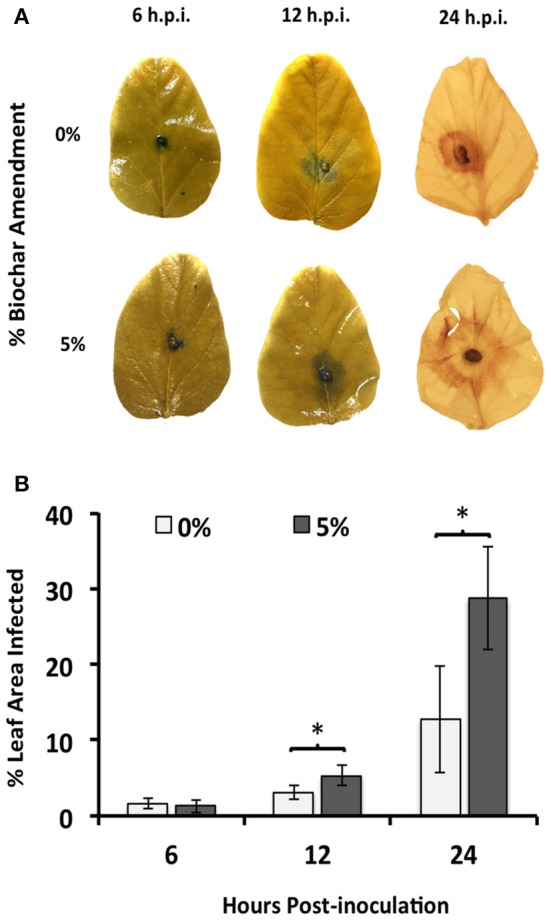
Figure 2.

Time course of R. solani infection upon 5% biochar amendment. (A) Average hyphal expansion at early infection stages (6 and 12 h.p.i.) and necrosis at late infection stages (24 h.p.i.) on detached leaves of soybean plants grown in the presence (5%) or absence (0%) of biochar amendment (w/w). One representative leaf is shown for each time point. (B) Average percent leaf area infected on detached leaves of soybean plants grown in the presence (5%) or absence (0%) of biochar amendment (w/w). Percent leaf area infected was determined by calculating the hyphal expansion (6 and 12 h.p.i.) or area of necrosis (24 h.p.i.) using Image J software (n = 12). Stars represent statistically significant differences between treatments using Student's t-test comparisons (P < 0.05), while bars represent 95% confidence intervals.
