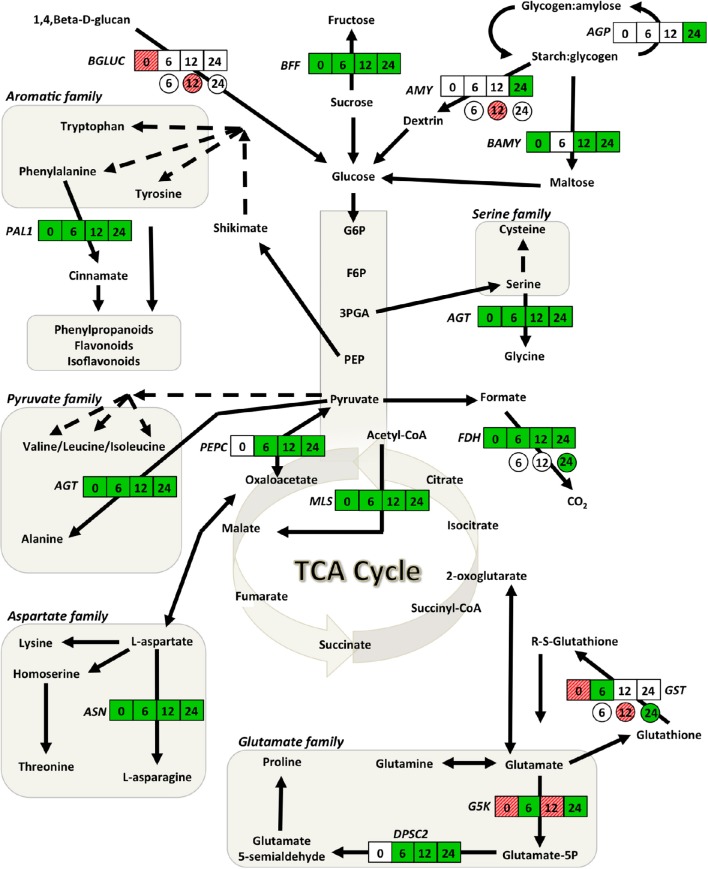
Figure 3.
Gene network analysis showing the time course fluctuations of transcript abundance of soybean and Rhizoctonia responsive genes in leaves of plants grown in the presence of 5% (w/w) biochar. Transcript fold changes of genes associated with primary metabolism for soybean (square) and R. solani (circle) were quantified at 0, 6, 12, and 24 h.p.i. Statistically significant (P < 0.05) and biologically significant (fold change ≥1.5 or ≤ −1.5) differences in transcript abundances are indicated in boxes/circles where green represents down-regulation, hashed-red up-regulation, and white represents no significant differences (n = 3). AGP, alpha-glucan phosphorylase; AGT, alanine-glyoxylate transaminase; AMY, alpha-amylase; ASN, asparagine synthetase; BAMY, beta-amylase; BFF, beta-fructo-furanosidase; BGLUC, beta-glucosidase; DPSC2, delta-1-pyrroline-5-carboxylate synthase 2; FDH, formate dehydrogenase; G5K, glutamate-5-kinase; GST, glutathione-S-transferase; MLS, malate synthase; PAL, phenylalanine ammonia lyase 1; PEPC, phosphoenolpyruvate carboxykinase 1.

