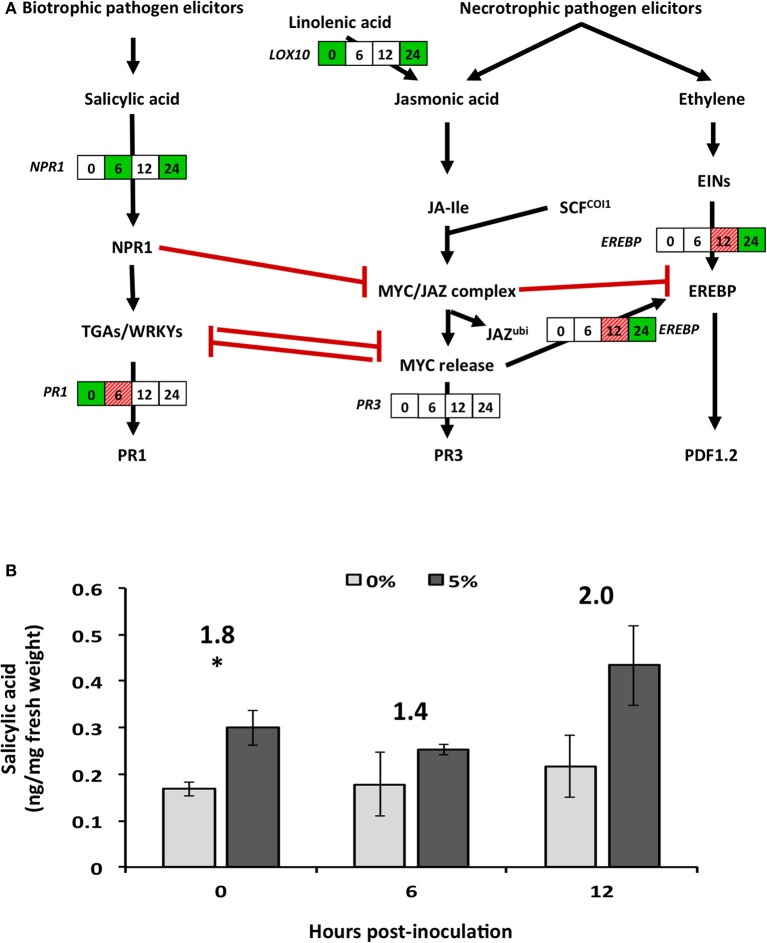
Figure 4.
Effect of biochar amendment on altered soybean genes and plant hormones associated with secondary metabolism. Soybean plants were grown in the presence (5%) or absence (0%) of biochar amendment (w/w) and transcript relative abundance and salicylic acid levels were quantified at 0, 6, 12, and 24 h.p.i. (A) Boxes represent soybean transcript abundance fold changes at 0, 6, 12, and 24 h.p.i. from left to right, respectively. Statistically significant (P < 0.05) and biologically significant (fold change ≥1.5 or ≤ −1.5) differences in transcript abundances are indicated in boxes where green represents down-regulation, hashed-red represents up-regulation, and white represents no significant differences (n = 3). (B) Salicylic acid hormone levels (ng/mg fresh weight) are represented as bar graph in the pathway. Stars represent statistically (P < 0.05) and biologically (fold change >1.5) significant differences in SA levels (n = 3). Numbers above the bars represent fold changes in hormone levels. EREBP, ethylene-responsive element-binding protein 13; LOX10, lipoxygenase 10; NPR1, non-expresser of PR 1; PR1, pathogenesis-related protein 1; PR3, pathogenesis-related protein 3.

