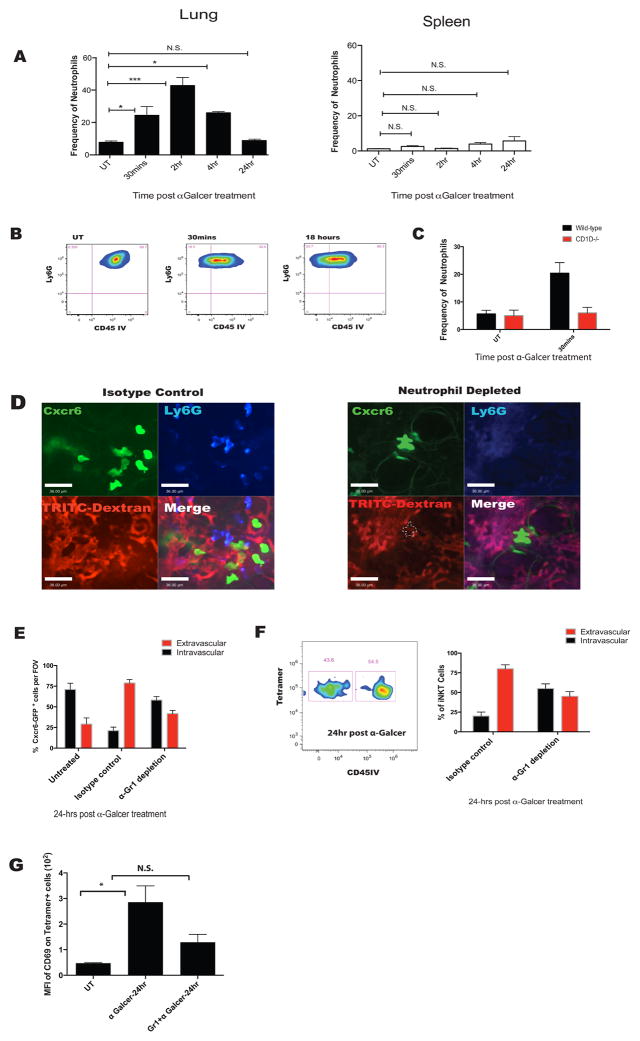
Figure 3. α-Galcer treatment results in an early influx of neutrophils that are necessary for iNKT cell migration out of the vasculature.
A. Flow cytometry was utilized to determine dynamics of neutrophil influx in the lung and spleen post i.v. α-Galcer treatment. Graphs represent frequency of neutrophils as a percentage of CD45+ cells. B. Extravasation of neutrophils post α-Galcer treatment as in (1E). C. Quantification of neutrophil percentages in total lung homogenate of CD1dKO mice and wild-type littermates. D. Representative IVM images after 24 hours of α-Galcer treatment in istoype control and neutrophil depleted mice. Cell types are labeled respectively. White dotted line defines the shadow left by CXC6GFP+ cells on TRITC-dextran channel. E. Quantification of IVM images in (D). F. iNKT cell localization measured using anti-CD45 infusion in neutrophil depleted and isotype treated mice after i.v. α-Galcer treatment. G. iNKT cell activation status measured using CD69 expression in neutrophil depleted or isotype treated mice after i.v. α-Galcer treatment. Error bars represent standard error of mean. ‘*’ represents P < 0.05. N = 3–5 animals per group.

