FIGURE 3.

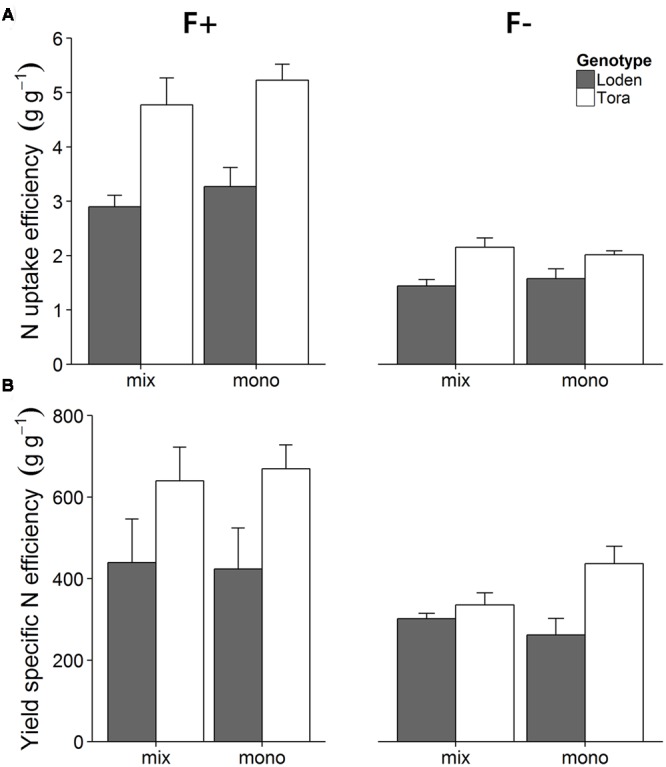
Effects of two fertilizer treatments (F+, F-) on N uptake efficiency (A) and yield specific N efficiency (B) of ‘Loden’ (gray) and ‘Tora’ (white) grown either in mixture (mix) or monoculture (mono). Values represent mean ± SE (n = 4).

Effects of two fertilizer treatments (F+, F-) on N uptake efficiency (A) and yield specific N efficiency (B) of ‘Loden’ (gray) and ‘Tora’ (white) grown either in mixture (mix) or monoculture (mono). Values represent mean ± SE (n = 4).