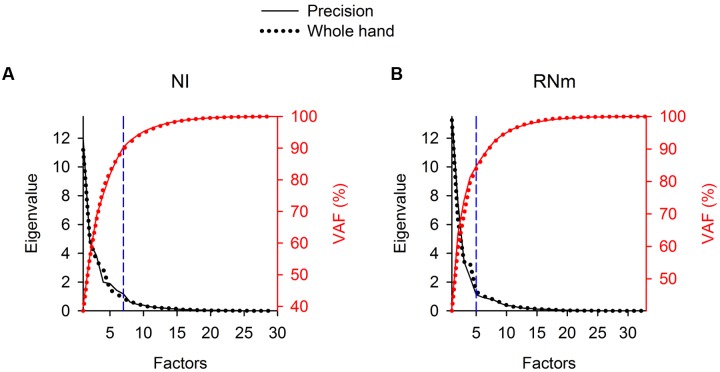
FIGURE 2.
Eigenvalues and percent variance accounted for (%VAF) of NI (A) and RNm (B) neuronal components in Monkey W. Scree plots (left ordinates, black) illustrate the progressive decrease in eigenvalues of extracted neuronal components as the number of components selected increases. The first 7 (in NI) or 5 (in RNm) components had eigenvalues > 1, which fulfills the Kaiser criteria for retaining factors as components. The “elbow” in the Scree plots (dashed, vertical blue lines) marks the cut off for retaining the first 7 (NI) or 5 (RNm) factors as neuronal components. Plots of %VAF (right ordinates, red) as a function of the number of factors demonstrate that the first 7 (or 5 in RNm) accounted for >85% of the variance in NI or RNm data. Solid lines show data for the precision task, dotted lines show data for the whole-hand task.

