
Figure 1.
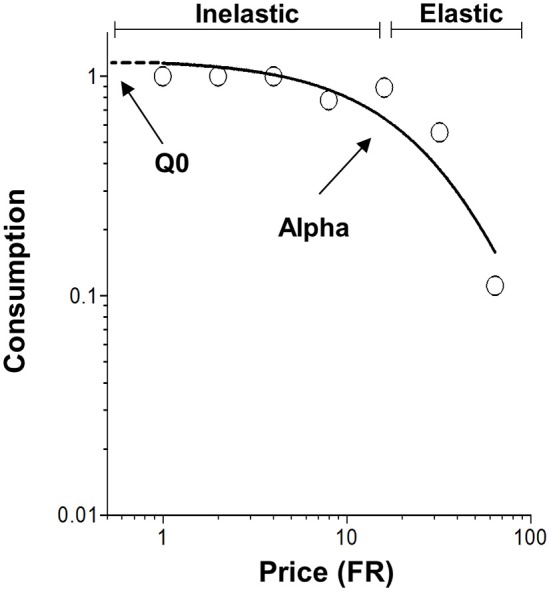
Representative demand curve plotting consumption as a function of price (Fixed ratio, FR). The open circles represent successful escapes made by subjects at each FR and the solid line represents the best fit demand curve determined by the exponential demand equation. The values of Q0 and α are determined by the exponential demand equation (Equation 1). Q0 is a measure of the hedonic value of footshock and is shown graphically as the y-intercept. α is a measure of demand elasticity and is inversely related to motivation. Inelastic demand occurs when the change in consumption is small relative to the change price. However, demand becomes elastic when the change in consumption is large relative to the change price.