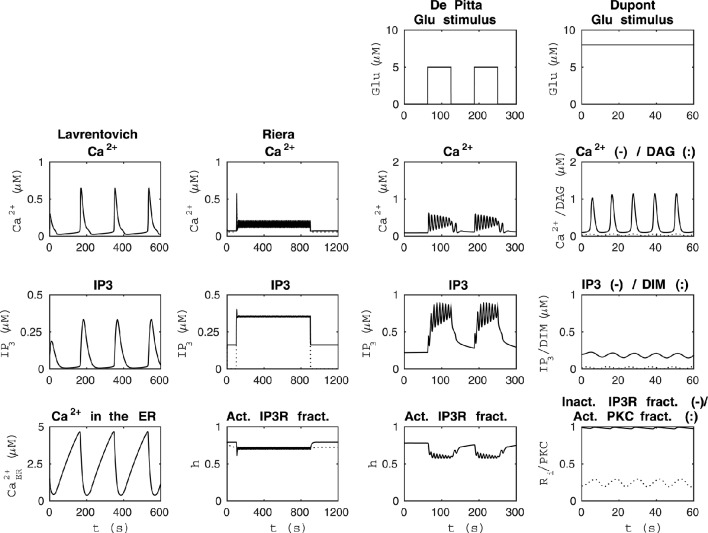
Figure 1.
Reproducibility of the basic model behavior with the original parameter values and stimulus. The first column from the left presents the simulation of the model by Lavrentovich and Hemkin (2008) in the same condition as Figure 3 of the original publication except that the concentrations of IP3 and Ca2+ in the ER were not plotted in the original publication (see Table 2). The second column from the left shows simulation results of our modified version of the model by Riera et al. (2011a) (see Table 3) when the total free Ca2+ concentration was set to a constant value of 2 μM (jin+vCCE−vOUT = 0) based on Figure 4b of the original publication and XIP3 was a pulse function. Thus, XIP3 was 0.43 μM/s between 100 and 900 s and either 0 (curves with dotted lines) or 0.2 μM/s (curves with solid lines) otherwise. The second column from the right shows simulation results in the same condition as Figure 12 AM of the original publication by De Pittà et al. (2009) (stimulus was a two-pulse wave with alternating Glu concentrations of 2 nM and 5 μM, pulse duration of 62.5 s, and period 125 s), except that the fraction of active IP3Rs (h) was not plotted in the original publication (see Table 4). The first column from the right shows simulation results of our modified version of the model by Dupont et al. (2011) in the same condition as Figure 2 of the original publication by Dupont et al. (2011) (stimulus was a constant Glu concentration of 8 μM), except that the IP3 concentration and fraction of inactive IP3Rs (Ri) were not plotted in the original publication (see Table 5). See Table 6 for more details.

