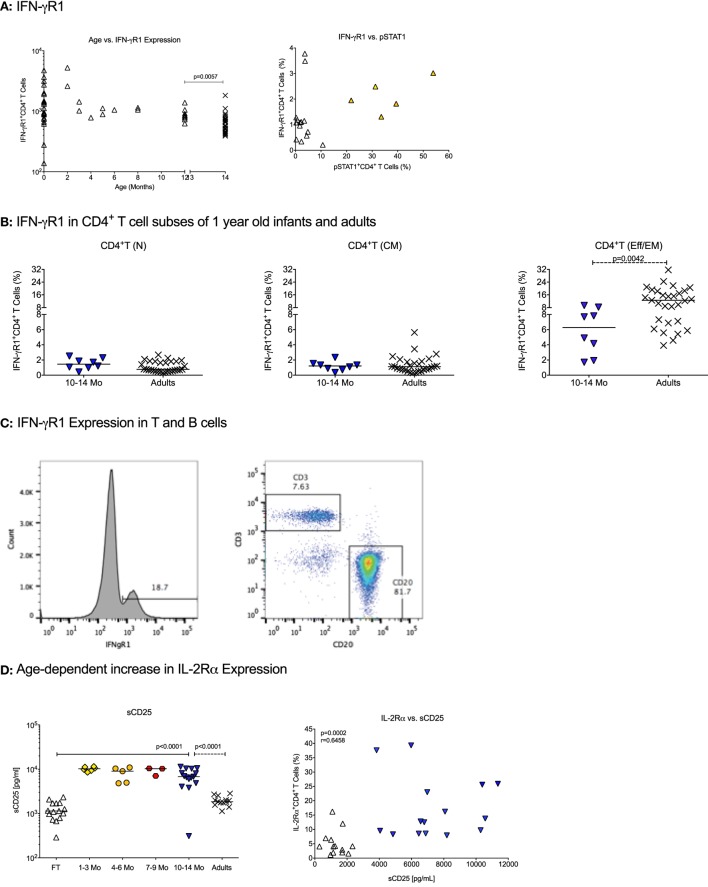
Figure 1.
Cytokine receptor expression in infants. (A) The changes in absolute numbers of IFN-γR1 on CD4+ T cells and the percentage of IFN-γ+ CD4+ T cells with age. Each symbol represents an individual infant (open triangle); adults are shown by black cross symbols. The p values indicate statistically significant differences between 10–14 months old infants and adults. (B) The percentage of IFN-γ+ CD4+ T cells in naïve [T(N)], central memory [T(CM)], and effector memory/effector [T(EM/Eff)] CD4+ T cells of 10- to 14-month-old infants and adults. (C) A representative histogram of IFN-γR1-positive cells in an infant blood sample. Note that the majority of IFN-γR1-positive cells represent B cells. (D) The left graph shows the age-dependent increase in soluble CD25 (sCD25) plasma levels. The right graph illustrates the Spearman rank correlation between sCD25 plasma levels and IL-2Rα+CD4+ T cells using infants at birth and 1 year. Each symbol represents an individual infant, with infants at different ages being characterized by specific symbols: cord blood (CB): open triangle, 1–3 months: yellow diamonds, 4–6 months: orange circles, 7–9 months: red hexagons, 10–14 months (1 year): blue triangles. Horizontal lines represent median values. The differences in plasma sCD25 levels between CB and 1-year olds were determined by Mann–Whitney test.

