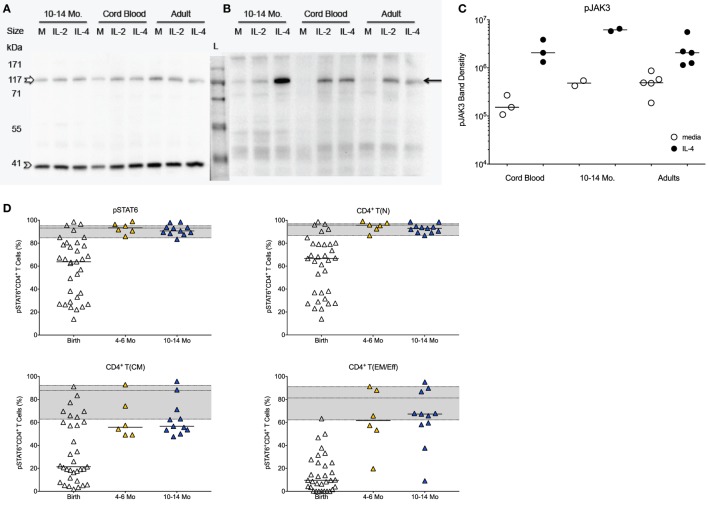
Figure 2.
JAK/STAT activation in infant CD4+ T cells in response to IL-4. (A) Representative Western blot gel for total JAK3 (upper band; empty white arrow) and the β-actin control (lower band, empty arrow head) using CD4+ T cell protein lysates from cord blood samples, 10- to 14-month-old infants and adults stimulated with IL-4 or IL-2 in comparison to media (M) only. (B) Representative Western blot showing phosphorylated JAK3 (pJAK; black arrow). (C) Western blot gels were analyzed by densitometry to determine relative changes in JAK3 activation in media or IL-4 stimulated CD4+ T cells. (D) The graphs show the frequencies of pSTAT6+ cells in total CD4+ T cells and in naïve [T(N)], central memory [T(CM)], and effector memory/effector [T(EM/Eff)] CD4+ T cell populations of at birth (n = 33), infants aged 4–6 (n = 6) and 10–14 (n = 11) months. The gray area in each graph represents the median frequencies (middle line) of pSTAT6+ CD4+ T cells in adults (n = 25), with the lower and upper line corresponding to the 25th and 75th percentile. Each symbol represents an individual subject, with the exception of (B): the samples for 10- to 14-month-old infants represent pools of nine or five subjects each. Statistical significant differences between two age groups were determined by non-parametric Mann–Whitney test.

