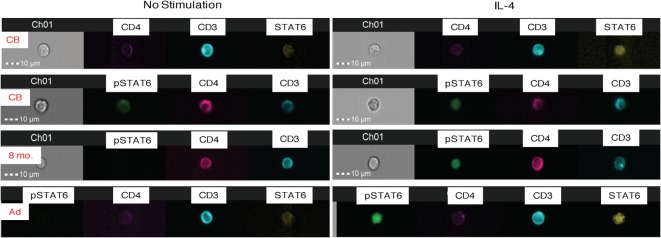
Figure 3.
Amnis®-ImageStreamX analysis of STAT6 activation. The images are representative examples of whole blood samples that were untreated (left panels) or stimulated with IL-4 for 15 min (right panels) and then stained and analyzed for total (unphosphorylated) STAT6 and activated pSTAT6. Each image row shows a single cell labeled with CD3 (blue), CD4 (pink), unphosphorylated STAT 6 (yellow), or phosphorylated STAT6 (pSTAT6; green). The first two rows represent examples of cord blood (CB) stained with STAT 6 or pSTAT6; followed by an 8-month old infant blood sample, and one adult donor blood. Channel 1 (“Ch1”) shows the brightfield image of the cell in relation to the 10-μm size marker.

