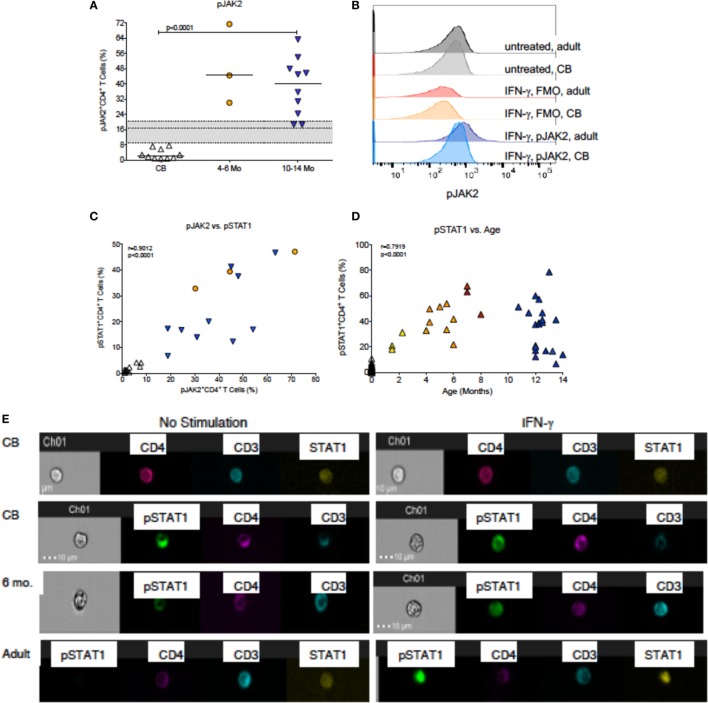
Figure 4.
IFN-γ-induced JAK/STAT signaling. (A) The percentages of pJAK2+CD4+ T cells in cord blood (CB, n = 10), 4- to 6-month-old (n = 3), and 10- to 14-month-old (n = 10) infants. Median frequencies of adult (n = 12) pJAK2+CD4+ T cells with the 25th and 75th percentile are indicated by the gray shaded area. (B) Representative pJAK2 histograms from a CB sample and an adult blood donor. Note that baseline pJAK2 levels are similar in CB and adult blood, and in IFN-γ stimulated samples, the FMO controls also do not differ between CB and adult blood. In contrast, there is an induction of pJAK2 in adult, but notCB, CD4+ T cells after IFN-γ stimulation. (C) The association between pJAK2+ and STAT1+ CD4+ T cells in relation to age through 14 months. Note that the analysis only included infant samples that had sufficient volume to measure both parameters. (D) The associations between pSTAT1+CD4+ T cells and age through 14 months. Correlations were determined by Spearman rank test. (E) Representative examples of CB, 6-month-old infant and adult blood samples analyzed by Amnis®-ImageStreamX for the nuclear localization of STAT1 and pSTAT1 in unstimulated samples (left panels) or after IFN-γ stimulation (right panels). The legend is as described in Figure 3.

