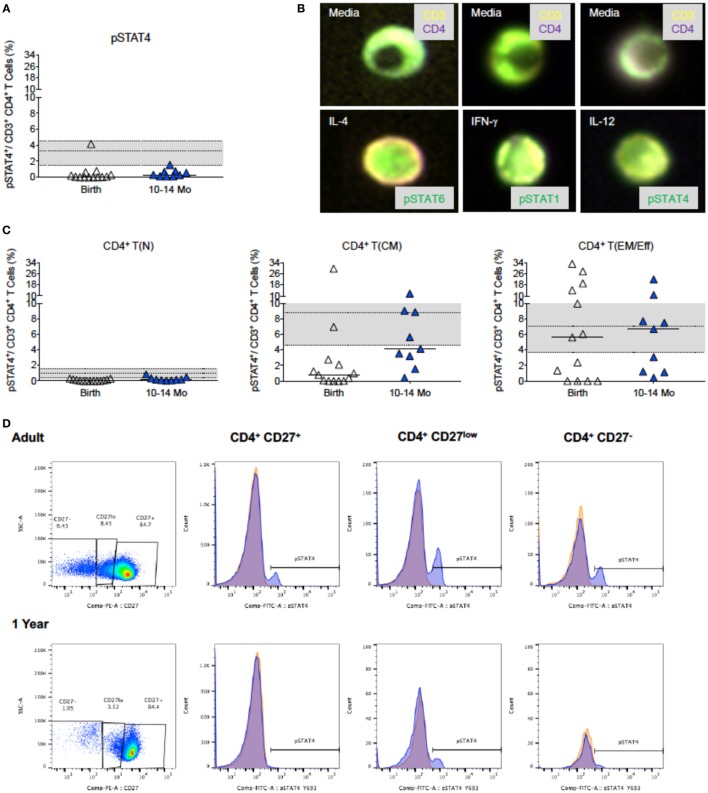
Figure 6.
IL-12-induced pSTAT4 activation. (A) The increase in pSTAT4 activation after IL-12 stimulation of CD4+ T cells at birth (n = 18) and 1 year (n = 17); adult values (n = 27) are indicated by the gray shaded area with median, 25th, and 75th percentile. (B) Representative composite images of CD4+ T cells from 6-month-old infants stimulated with media only (top row), or with (bottom row) IL-4, IFN-γ, or IL-12 and analyzed by Amnis®-ImageStreamX for the nuclear localization of their relevant transcription factor. Note the distinct nuclear localization of pSTAT6 and pSTAT1 that fills almost the whole nucleus in comparison to only partial pSTAT4 nuclear localization. (C) is analogous to (A), but shows the induction of pSTAT4 in T(N), T(CM), and T(EM/Eff) CD4+ T cells. The legend and the statistical comparisons are as described in Figures 1 and 2. (D) The relative frequencies of naïve [CD27+, T(N)], central memory [CD27low, T(CM)], and effector memory/effector [CD27−, T(EM/Eff)] CD4+ T cell populations of a representative adult and 1-year-old infant and the corresponding histograms of pSTAT4 activation after IL-12 stimulation (blue). pSTAT4 frequencies in unstimulated controls are shown by orange histograms.

