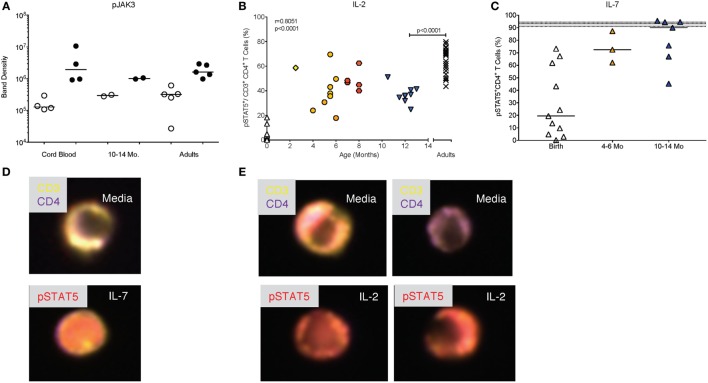
Figure 7.
Differential activation of pSTAT5 by IL-2 and IL-7. (A) Western blot analysis of pJAK3 activation as described in Figure 2C. (B) The age-dependent change in pSTAT5+ CD4+T cells from birth to 14 months of age with Spearman rank correlation values. Adult values are shown in comparison and were compared to 10- to 14-month-old infants by Mann–Whitney test. (C) Frequencies of pSTAT5+ CD4+T cells in response to in vitro IL-7 stimulation are shown for cord blood (n = 11), 4- to 6-month-old (n = 3), and 10- to 14-month-old (n = 7) infants. The gray area indicates median frequencies of adult pSTAT5+ CD4+T (n = 17) with borders representing the 25th and 75th percentiles. Each symbol represents an individual subject. Horizontal lines represent median values. Each age group is assigned a different symbol as described in Figure 1; Mann–Whitney test was used for between group comparisons. (D,E) Representative composite images of CD4+ T cells from 6-month-old infants stimulated with IL-7 (D) or IL-2 (E) and analyzed by Amnis®-ImageStreamX. The response of CD4+ T cells to IL-2 was more variable with some cells showing pSTAT5 activation and nuclear localization (left images), whereas other cells remained unresponsive, indicated by lack of nuclear staining with pSTAT5 (right images). In contrast, the majority of CD4+ T cells showed pSTAT5 activation and nuclear translocation after IL-7 stimulation.

