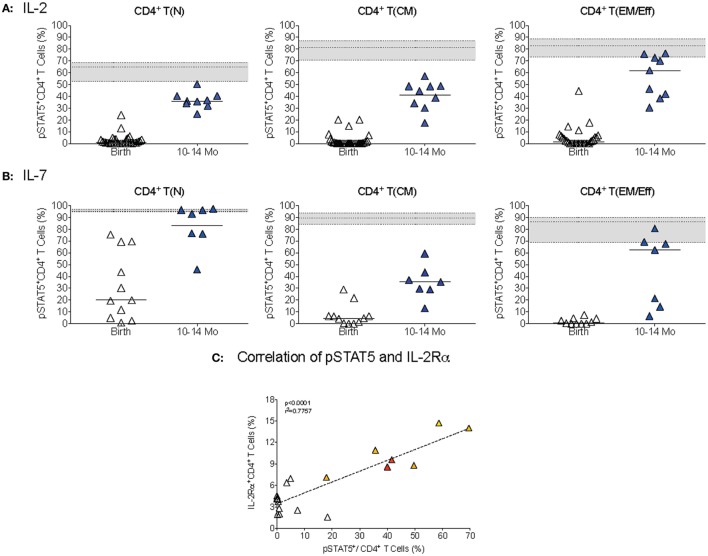
Figure 8.
CD4+ T cell differentiation in STAT5 activation. (A,B) The percentages of T(N), T(CM), and T(EM/Eff) CD4+ T cells that were activated pSTAT5 in response to IL-2 (A) or IL-7(B), respectively, in infant blood samples collected at birth and 1 year. Each symbol represents an individual infant; horizontal lines represent median values. The gray area indicates median frequencies of adult pSTAT5+ CD4+T cells (n = 17) with borders representing the 25th and 75th percentiles. (C) The correlation by Spearman rank test between pSTAT5+CD4+T cells and IL-2Rα+ CD4+ T cells in infant samples of different ages (colored symbols as explained in Figure 1). Note that we only included samples that were analyzed for both pSTAT5+ activation and IL-2Rα+ expression.

