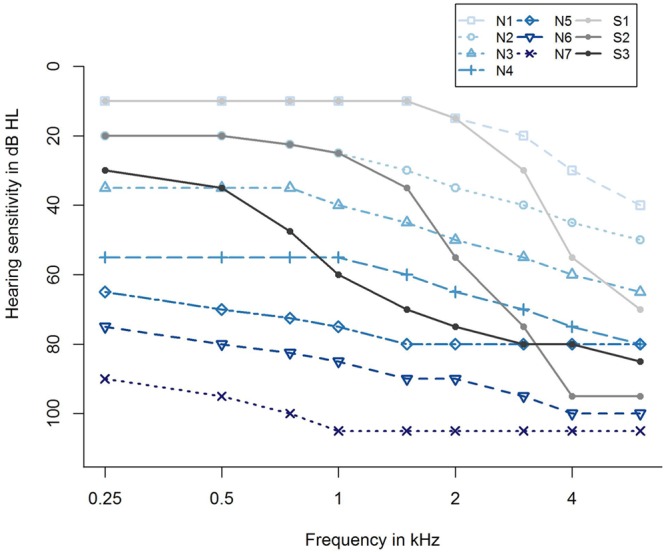
FIGURE 2.

Ten standard audiograms used for grouping the participants regarding their hearing loss profile (Bisgaard et al., 2010). Shown are audiogram profiles for individuals with different degrees of hearing loss (N1,…, N7 and S1, S2, S3) distinguishing between a flat/moderately sloping (N) and a steep sloping hearing loss (S). The profiles N1,…, N7 refer to a very mild, mild, moderate, moderate/severe, severe, severe, and profound (flat/moderately sloping) hearing loss, and S1, S2, S3 indicate a very mild, mild, and moderate/severe (steep sloping) hearing loss.
