FIGURE 4.

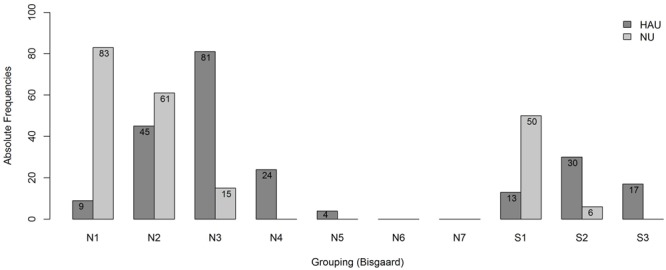
Frequency distribution of the subgroups. Shown are absolute frequencies of the groups N1,…, N7 and S1, S2, S3 among HAU and NU of in total 438 participants.

Frequency distribution of the subgroups. Shown are absolute frequencies of the groups N1,…, N7 and S1, S2, S3 among HAU and NU of in total 438 participants.