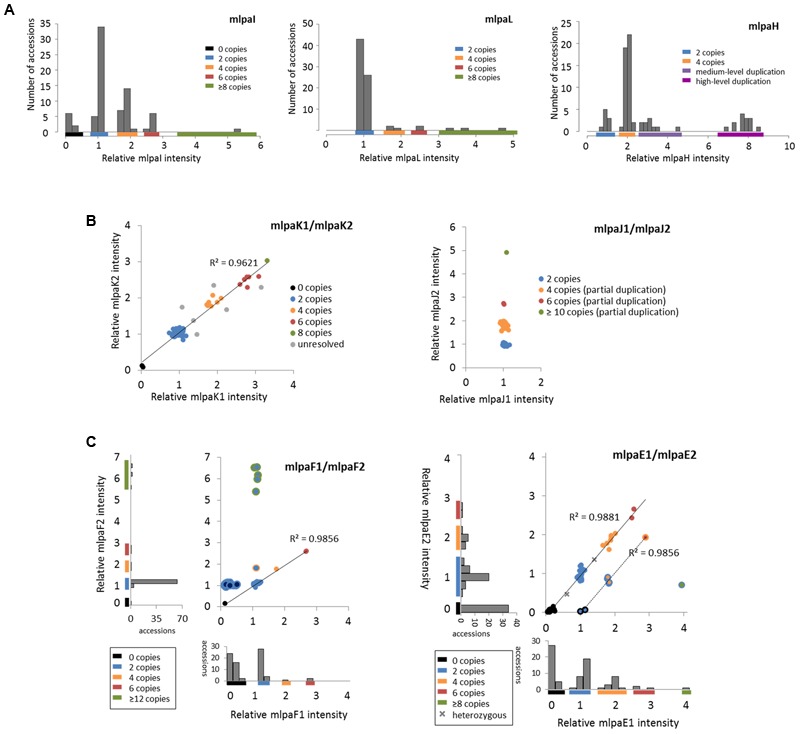
FIGURE 5.

Multiplex ligation-dependent probe amplification results for multiallelic CNVs. (A) CNV genotyping with one MLPA probe per gene. Histograms present the relative signal distribution from probe mlpaI (targeting the AT4G37685 gene), probe mlpaL (targeting the AT5G61700 gene), and probe mlpaH (targeting the AT4G27080 gene). The histogram bin size is 0.2 in all plots; (B) CNV genotyping with two MLPA probes per gene. 2D plots present the relative signal from probes mlpaK1and mlpaK2 (both targeting the AT5G54710 gene) and from probes mlpaJ1 and mlpaJ2 (both targeting the AT5G09590 gene). Clusters are colored according to deduced CNV status. The coefficient of determination (R2) is calculated for accessions with assigned copy numbers. (C) Genotyping complex multiallelic CNVs. 2D intensity plots present relative signal from probes mlpaF1and mlpaF2 (targeting exon 1 and exon 2 of the AT3G21960 gene, respectively) and from probes mlpaE1and mlpaE2 (targeting exon 6 and exon 9 of the AT1G52950 gene, respectively). Clusters are colored according to deduced CNV status. The coefficient of determination (R2) is calculated for subsets of accessions, as detailed in the main text.
