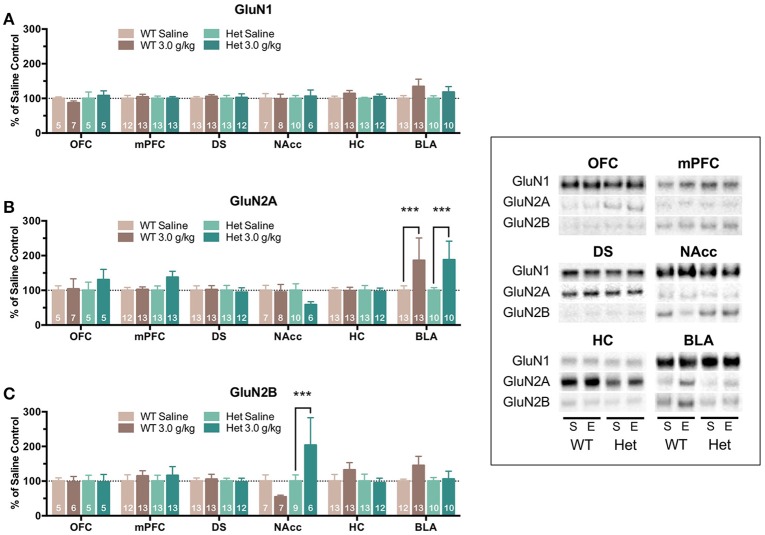
Figure 2.
Effects of repeated ethanol treatment on NMDAR subunit expression in wild-type and F639A mice. Western blot analysis of GluN1 (A), GluN2A (B), GluN2B (C) subunit expression from wild-type and F639A mice treated with 8 injections of saline (S) or ethanol (E; 3.0 g/kg) administered every other day. Tissue was collected 24 h following the last injection from orbitofrontal cortex (OFC), medial prefrontal cortex (mPFC), dorsal striatum (DS), nucleus accumbens (NAcc), hippocampus (HC), and basolateral amygdala (BLA). Mean (±SEM) optical density values for protein bands are shown as percent of corresponding saline controls run the in same blot. Symbols: value significantly different from corresponding saline injected mice (***p < 0.001). Inset shows representative example of western blot showing NMDA subunit expression in saline (S) and ethanol (E) treated wild-type (WT) and F639A (Het) mice.

