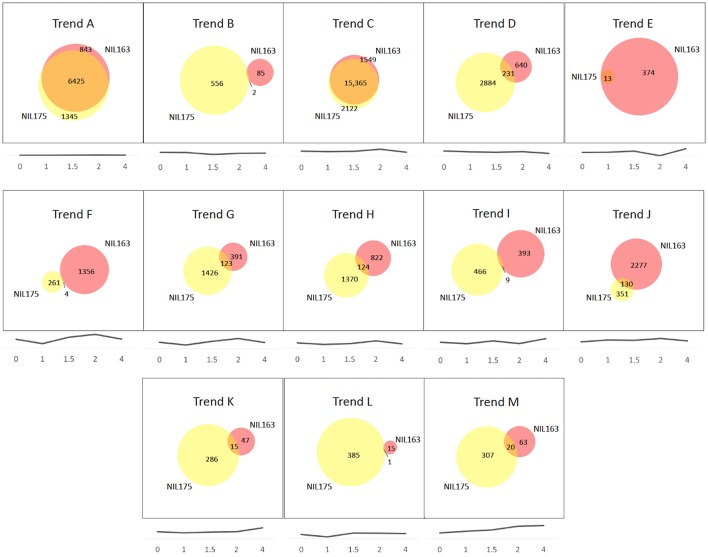
Figure 2.
Trend group comparisons of NIL175 and NIL163. Trend Groups were identified from cluster analysis of gene transcription patterns for NIL175 and NIL163. For each Trend Group A-M, Venn diagrams show relative gene space of unique genes for NIL175 (yellow), NIL163 (pink), and overlapping genes (orange). Below each Venn diagram, the trend line corresponding to the given Trend Group is displayed. Experiment time-points in hours are designated along the x-axis. Y-axis values are in relative log scale (not shown), with y-axis range adjusted for each graph to maintain relative changes between time-points while displaying the trend line close to the x-axis for display purposes. Venn diagrams were created using BioVenn (www.cmbi.ru.nl/cdd/biovenn/).

