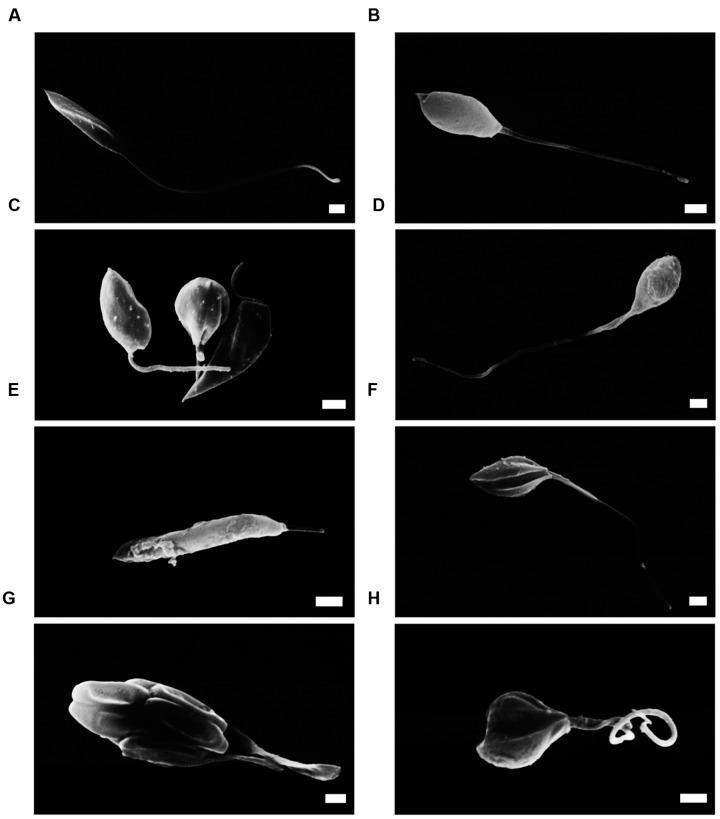
FIGURE 1.
Scanning electron microscopy (SEM) of L. amazonensis promastigotes. (A) promastigotes control; (B,C) promastigotes treated with concentrations that corresponded to the BZTS IC50 and IC90, respectively; (D,E) morphology alterations after miltefosine IC50 and IC90 treatment, respectively; (F) drug combination, at IC50; (G,H) promastigote treated with IC90 of drug combination. Scale bar = 1 μm.

