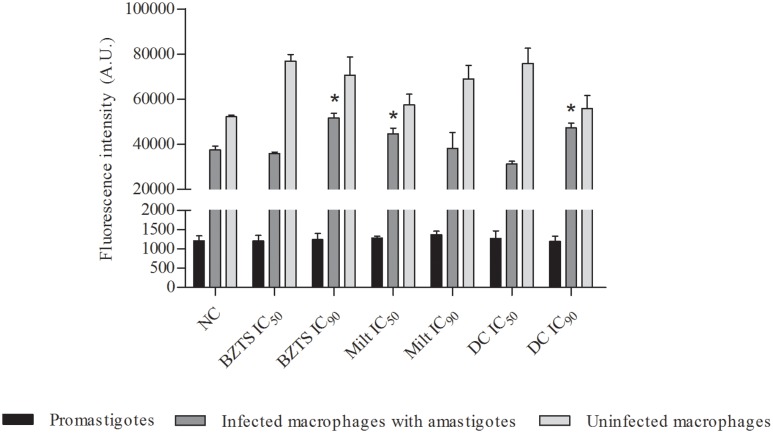
FIGURE 8.
Measure of nitric oxide production from promastigotes, macrophages infected with amastigotes and uninfected macrophages. Cells were untreated (NC, negative control) and treated with BZTS and miltefosine alone and in combination (DC, drug combination). Intensity fluorescence emitted from DAF-2T was quantifying by Victor X3 (Perkin-Elmer) fluorometer. At least three independent experiments were analyzed. ∗P ≤ 0.05, significant difference from infected NC group.

