Fig. 7.

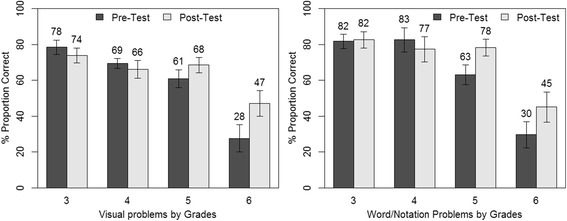
Proportion correct for visual representation problems (left) and word/notation representation problems (right) by grade for the math test, with mean values for each test and standard error bars

Proportion correct for visual representation problems (left) and word/notation representation problems (right) by grade for the math test, with mean values for each test and standard error bars