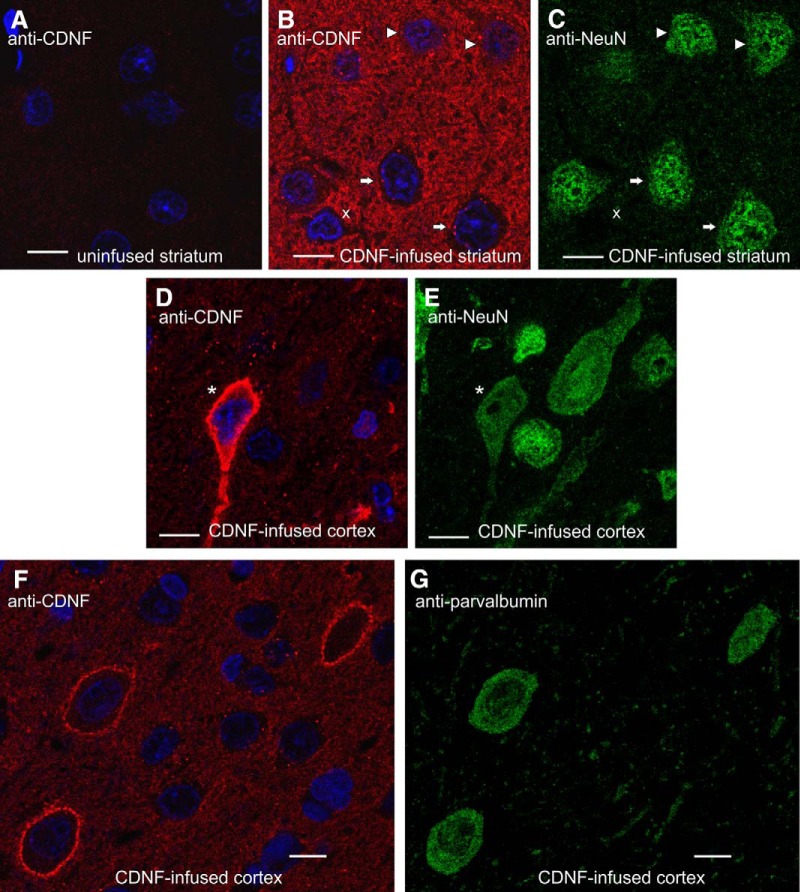
Figure 2.
Subcellular localization patterns of infused rhCDNF in rat brain. Representative images of anti-CDNF IR at the 2 h time point, as observed by confocal fluorescence microscopy (n = 4). A–E, Sections from the rhCDNF-infused (20 µg) or contralateral uninfused hemisphere were double stained with anti-CDNF antibodies (A, B, D) and anti-NeuN antibodies (C, E). F, G, Sections from rhCDNF-infused hemisphere were double stained with anti-CDNF antibodies (F) and anti-parvalbumin antibodies (G). White arrows mark NeuN-positive cells that exhibit only the punctate CDNF-IR pattern, arrowheads mark cells that also exhibit diffuse anti-CDNF IR in the cytoplasm, the asterisk marks a neuron with strong cytoplasmic anti-CDNF IR, and a non-neuronal cell is marked with letter “x.” DAPI was used to stain nuclei (shown in blue). Scale bar, 10 µm.

