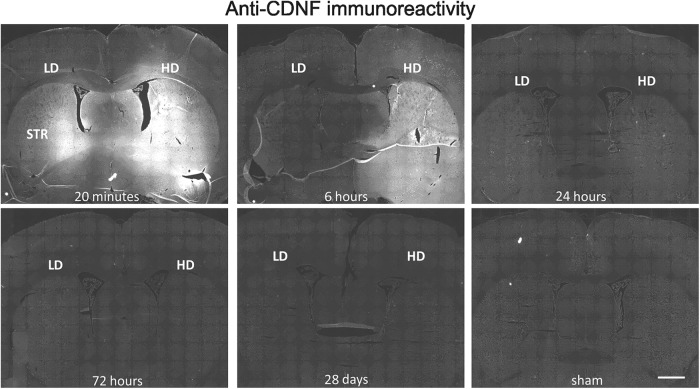
Figure 7.
Spreading and clearance of rhCDNF after intrastriatal infusion. Representative images of anti-CDNF IR at different time points after infusion into striatum. Coronal sections from the level of A/P −0.3 are shown. LD, Low dose (3.7 µg) of rhCDNF; HD, high dose (16 µg) of rhCDNF; STR, striatum. Scale bar, 1 mm.

