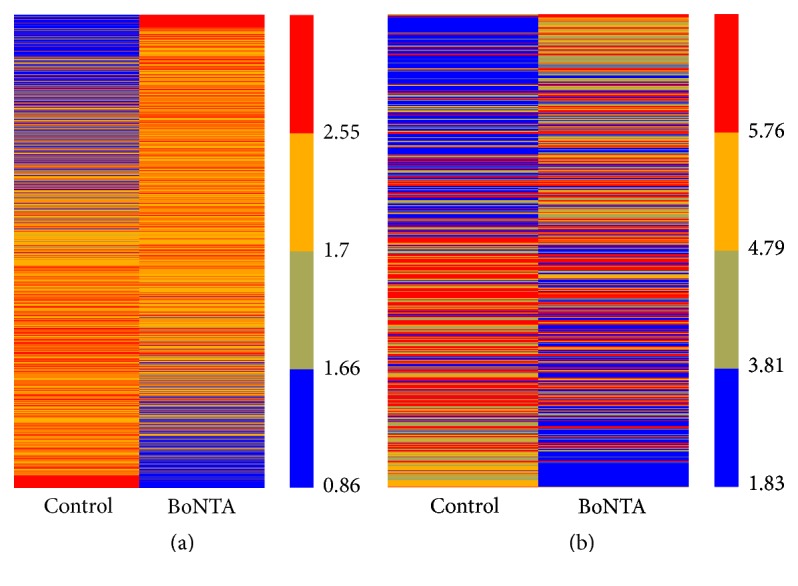
Figure 1.

Heat maps presentation of the expression profiling of mRNAs (a) and lncRNAs (b) in different groups of HDFs. Red and blue represent high and low relative expressions, respectively. Control indicates the normal HDFs and BoNTA indicates the HDFs treated by BoNTA (5 U/106 cells 48 h).
