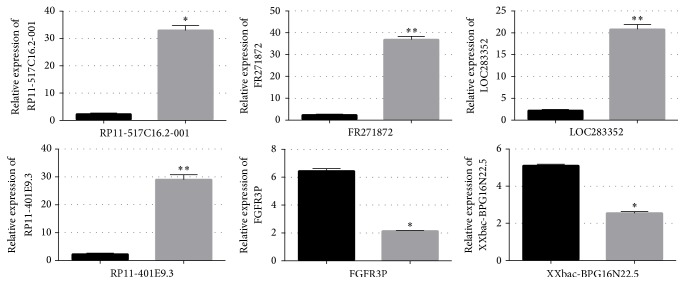
Figure 2.
The differential expression level of long noncoding RNAs (lncRNAs) between control and BoNTA (5 U/106 cells 48 h) treated groups was validated by qRT-PCR. Six lncRNAs (RP11-517C16.2-001, FR271872, LOC283352, RP11-401E9.3, FGFR3P, and XXbac-BPG16N22.5) were studied using glyceraldehyde-3-phosphate dehydrogenase (GAPDH) as an internal control. The heights of the columns in the chart represent the fold changes. Data are the mean ± SEM (n = 6). p < 0.05 was considered to indicate a statistically significant difference compared with control HDFs. ∗p < 0.05 and ∗∗p < 0.01.

