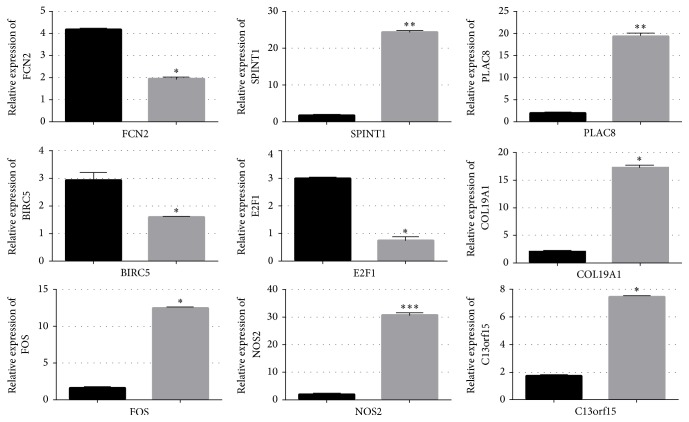
Figure 3.
The differential expression levels of message RNAs (mRNAs) between control and BoNTA (5 U/106 cells 48 h) treated groups of microarray results were validated by qRT-PCR. Nine mRNAs (FCN2, SPINT1, PLAC, BIRC5, E2F1, COL19A1, FOS, NOS2, and C13orf15) were studied using glyceraldehyde-3-phosphate dehydrogenase (GAPDH) as an internal control. The heights of the columns in the chart represent the fold changes. Data are the mean ± SEM (n = 6). p < 0.05 was considered to indicate a statistically significant difference compared with control HDFs. ∗p < 0.05, ∗∗p < 0.01, and ∗∗∗p < 0.001.

