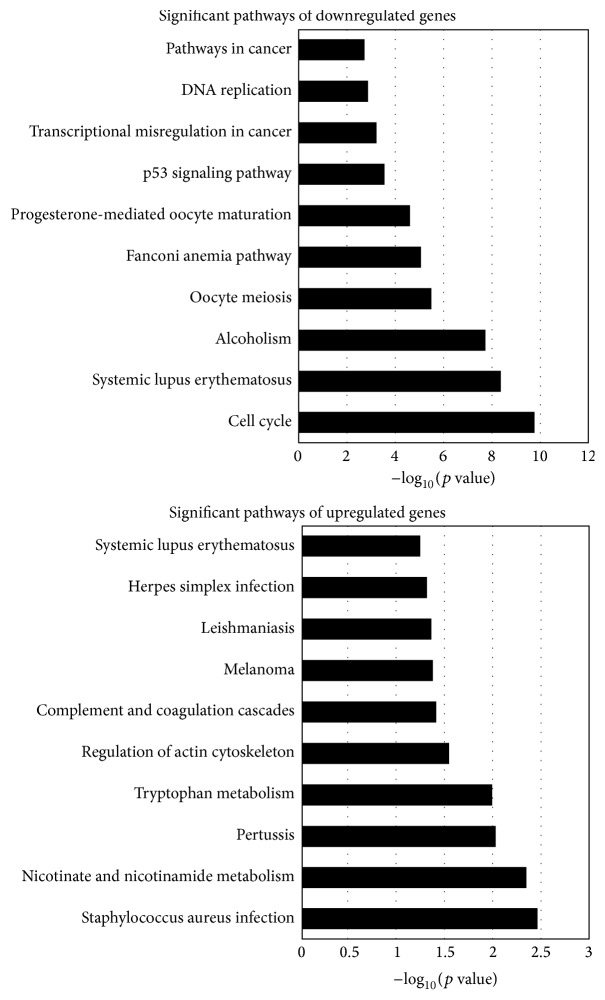
Figure 5.
Pathway analysis of the differentially expressed genes. Fisher's exact test was used to select the main pathway, and the significance threshold was defined with p value. The lower the p value, the more significant the pathway (p value ≤0.05 is recommended). We can get some information about the possibility between the differentially expressed genes and the change of cellular pathways.

