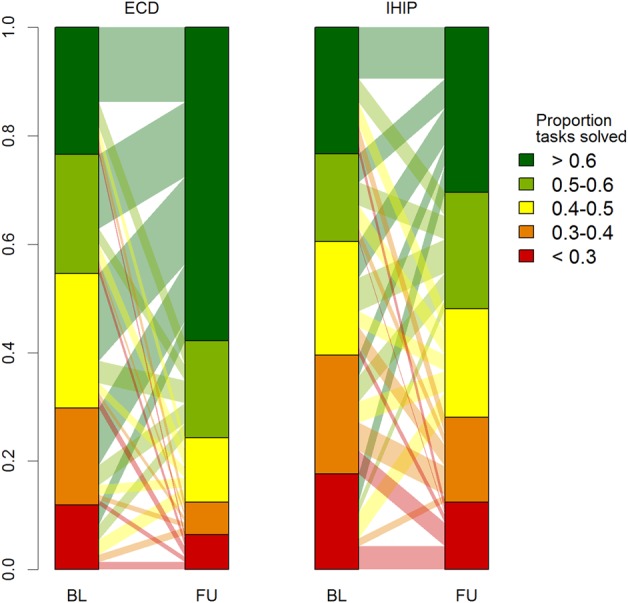
Figure 4.

Comparison between children in the EDC and IHIP group showing baseline and final assessment performance in achieving ECD evaluation assessment tasks. Vertical scale represents proportion of children belonging to a certain performance category. BL, baseline; FU, follow-up; ECD, early child development; IHIP, integrated home-based intervention package. Transparent connecting bars show the proportional transfer from the baseline categories to follow-up categories.
