Figure 7.
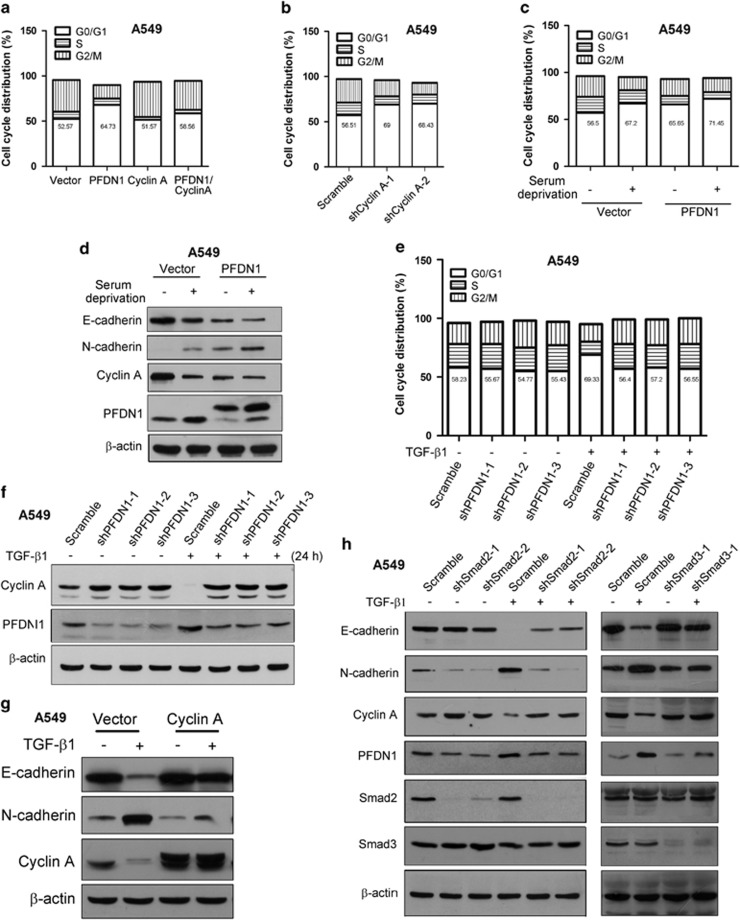
The interplay between TGF-β1 signaling and PFDN1/cyclin A. The percentage of cells in different phases of the cell cycle under the indicated experimental conditions was determined by flow-cytometric analysis (FACS) of DNA content (a–c and e). (a) The effect of PFDN1 and/or cyclin A overexpression on cell cycle distribution. (b) The effect of cyclin A knockdown on cell cycle distribution. (c) The effects of PFDN1 on cell cycle distribution in serum-starved cell cultures. PFDN1-overexpressed and vector-control A549 cells were serum-starved for 48 h. (d) The effect of PFDN1 on EMT induction and the expression of cyclin A in the absence of serum. The expression levels of cyclin A, PFDN1, E-cadherin and N-cadherin were examined by immunoblotting. (e) The effect of PFDN1 knockdown on the TGF-β1-induced increase in the percentage of cells in G0/G1 phase. Cells were treated with TGF-β1 (2 ng/ml) for 48 h, the percentage of cells in different cell cycles was determined by FACS assay. (f) The effect of PFDN1 knockdown on TGF-β1-induced downregulation of cyclin A levels. Cells were treated with TGF-β1 (2 ng/ml) for 24 h, and the levels of cyclin A and PFDN1 were detected by immunoblotting. (g) The effect of cyclin A overexpression on TGF-β1-induced EMT. The expression of E-cadherin, N-cadherin and cyclin A was determined by immunoblotting. (h) The effects of smad2 or smad3 knockdown on TGF-β1-induced EMT and changes in expression levels of PFDN1 and cyclin A. The levels of E-cadherin, N-cadherin, PFDN1, cyclin A, smad2 and smad3 were examined by immunoblotting.

