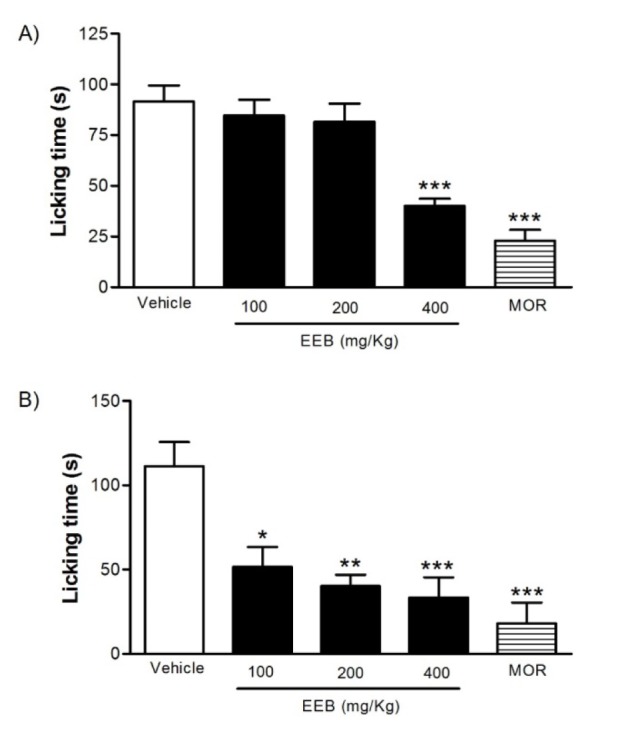
Figure 3. Effects of EEB of H. umbrosa on the formalin-induced nociception in mice. Vehicle (control), EEB (100, 200 and 400 mg/kg) or morphine (MOR) were administered p.o. 1 h before formalin injection. (A) Represents the first phase and (B) represents second phase of formalin-induced nociception. Each column represents mean ± S.E.M. (n = 8, per group). *p < 0.01, ** p > 0.01 or ***p < 0.001 versus control (ANOVA followed by Tukey's test).

