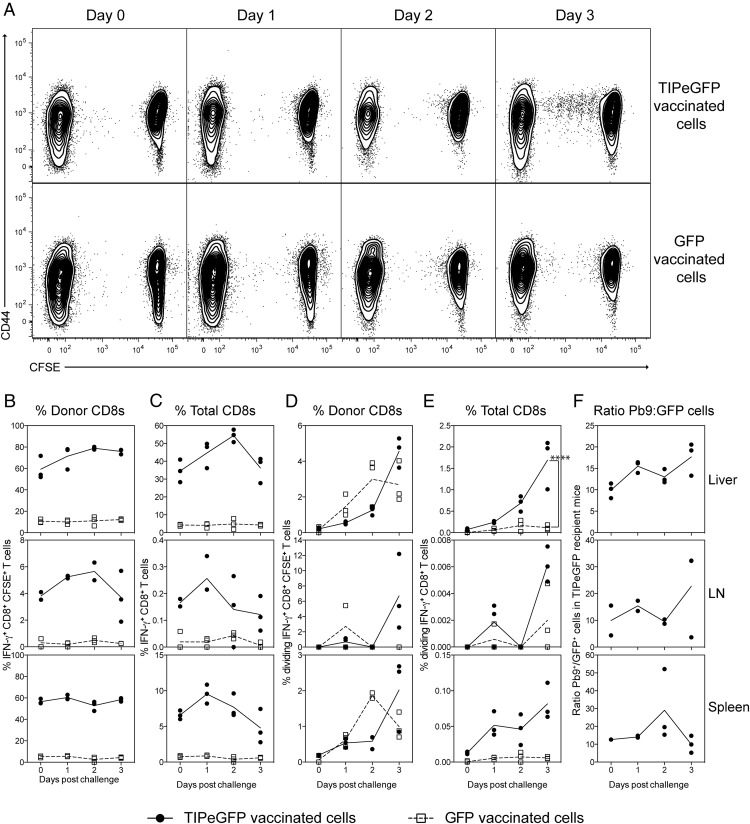
FIGURE 1.
Kinetics of the liver-stage response to malaria. CFSE-labeled splenocytes (1 × 10⁷) from HAd5-MVA TIPeGFP or GFP-vaccinated mice were transferred into BALB/c mice 1 d prior to i.v. challenge with 1000 P. berghei sporozoites. Mice were sacrificed before challenge (day 0) and 1, 2, and 3 d postchallenge to analyze the response in the livers and liver-draining lymph nodes (celiac and portal) by flow cytometry. Cells were stimulated with Pb9 or GFP peptide for 6 h prior to surface staining with Live/Dead Aqua, CD8–Pacific Blue, CD62L-PerCP-Cy5.5, CD127–bi av-qDot 565, CD4–eFluor 450, CD25–Alexa Fluor 700, CD44-allophycocyanin-Cy7, and intracellular staining for IL-2–PE, TNF-α–PE-Cy7, and IFN-γ–allophycocyanin. Representative dot plots (A) show CD44 versus CFSE expression of all CD8+ T cells isolated from the liver after sporozoite challenge. Owing to the low frequency of dividing cells observed, the Pb9, GFP, and media fcs file from each mouse were pooled together (concatenated) for presentation. Graphs represent the frequency of Pb9 IFN-γ–producing CD8+ T cells from TIPeGFP-vaccinated mice (●) or GFP IFN-γ–producing CD8+ T cells (□) from GFP-vaccinated mice as a percentage of donor CFSE+CD8+ T cells (B) or total CD8+ T cells (C), the frequency of dividing cells as a percentage of donor CFSE+CD8+ T cells (D), or total CD8+ T cells (E) isolated from the liver (top panel), liver-draining lymph node (middle panel), or spleen (bottom panel). (F) The graph represents the ratio of IFN-γ+ Pb9 to IFN-γ+ GFP cells in each organ only in the TIPeGFP recipient mice. Each animal is represented by a single point and the mean per group is represented by the line; data are representative of two similar experiments.

